Plot shapes onto a ternary diagram created with TernaryPlot(),
or a Holdridge plot created with HoldridgePlot().
Usage
AddToTernary(PlottingFunction, coordinates, ...)

TernaryArrows(fromCoordinates, toCoordinates = fromCoordinates, ...)

TernaryLines(coordinates, ...)

TernaryPoints(coordinates, ...)

TernaryPolygon(coordinates, ...)

TernarySegments(fromCoordinates, toCoordinates = fromCoordinates, ...)

TernaryText(coordinates, ...)

JoinTheDots(coordinates, ...)

AddToHoldridge(PlottingFunction, pet, prec, ...)

HoldridgeArrows(fromCoordinates, toCoordinates = fromCoordinates, ...)

HoldridgeLines(pet, prec, ...)

HoldridgePoints(pet, prec, ...)

HoldridgePolygon(pet, prec, ...)

HoldridgeText(pet, prec, ...)
Arguments
- PlottingFunction
Function to add data to a plot; perhaps one of
points,linesortext.- coordinates
A list, matrix, data.frame or vector in which each element (or row) specifies the three coordinates of a point in ternary space. Each element (or row) will be rescaled such that its entries sum to 100.
- ...
Additional parameters to pass to
PlottingFunction(). If usingTernaryText(), this will likely include the parameterlabels, to specify the text to plot. Other useful graphical parameters includesrtto rotate text.- fromCoordinates, toCoordinates
For
TernaryArrows(), coordinates at which arrows should begin and end; cf.x0,y0,x1andy1in arrows. Recycled as necessary.- pet, prec
Numeric vectors giving potential evapotranspiration ratio and annual precipitation (in mm).
Functions
TernaryArrows(): Add arrowsTernaryLines(): Add linesTernaryPoints(): Add pointsTernaryPolygon(): Add polygonsTernarySegments(): Add segmentsTernaryText(): Add textJoinTheDots(): Add points, joined by linesHoldridgeArrows(): Add arrows to Holdridge plotHoldridgeLines(): Add lines to Holdridge plotHoldridgePoints(): Add points to Holdridge plotHoldridgePolygon(): Add polygons to Holdridge plotHoldridgeText(): Add text to Holdridge plot
See also
Other Holdridge plotting functions:
HoldridgeHypsometricCol(),
HoldridgePlot(),
holdridge,
holdridgeClasses
Examples
# Data to plot
coords <- list(
A = c(1, 0, 2),
B = c(1, 1, 1),
C = c(1.5, 1.5, 0),
D = c(0.5, 1.5, 1)
)
# Set up plot
oPar <- par(mar = rep(0, 4), xpd = NA) # reduce margins and write in them
TernaryPlot()
# Add elements to ternary diagram
AddToTernary(lines, coords, col = "darkgreen", lty = "dotted", lwd = 3)
TernaryLines(coords, col = "darkgreen")
TernaryArrows(coords[1], coords[2:4], col = "orange", length = 0.2, lwd = 1)
TernaryText(coords, cex = 0.8, col = "red", font = 2)
seeThruBlue <- rgb(0, 0.2, 1, alpha = 0.8)
TernaryPoints(coords, pch = 1, cex = 2, col = seeThruBlue)
AddToTernary(graphics::points, coords, pch = 1, cex = 3)
 # An equivalent syntax applies to Holdridge plots:
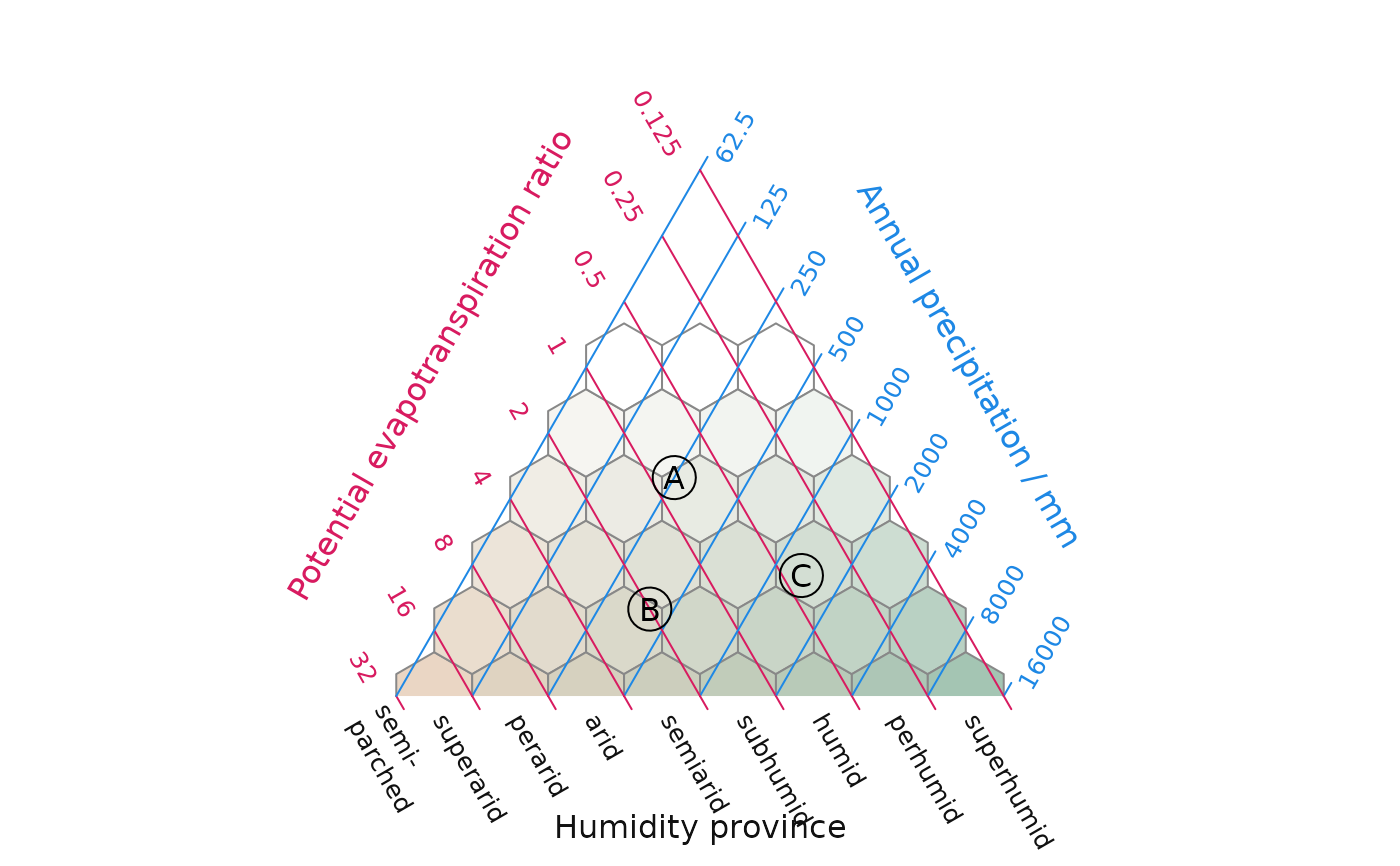
HoldridgePlot()
pet <- c(0.8, 2, 0.42)
prec <- c(250, 400, 1337)
HoldridgeText(pet, prec, c("A", "B", "C"))
AddToHoldridge(graphics::points, pet, prec, cex = 3)
# An equivalent syntax applies to Holdridge plots:
HoldridgePlot()
pet <- c(0.8, 2, 0.42)
prec <- c(250, 400, 1337)
HoldridgeText(pet, prec, c("A", "B", "C"))
AddToHoldridge(graphics::points, pet, prec, cex = 3)
 # Restore original plotting parameters
par(oPar)
# Restore original plotting parameters
par(oPar)