Prints an annotated vertical bar coloured according to a continuous palette.
Usage
SpectrumLegend(
  x = "topright",
  ...,
  palette,
  legend,
  lty = 1,
  lwd = 4,
  bty = "o",
  adj = if (horiz) c(0.5, 0.5) else c(0, 0.5),
  horiz = FALSE,
  lend = "butt",
  cex = 1,
  seg.len = 1
)

SizeLegend(
  x = "topright",
  ...,
  legend = character(0),
  width = c(0, 1),
  palette = par("col"),
  scale = c("pch", "lwd"),
  lty = 0,
  lwd = 4,
  bty = "o",
  adj = if (horiz) c(0.5, 0.5) else c(0, 0.5),
  horiz = FALSE,
  lend = "butt",
  cex = 1,
  seg.len
)
Arguments
- x, horiz, adj, seg.len, ...
Additional parameters to
legend().- palette
Colour palette to depict. Specify either a vector of colours, or a function such that
palette(n)returns a vector of n colours.- legend
Character vector with which to label points on
palette. Note that, in a vertical legend, values will be printed from top down; userev()to reverse the order.- lwd, lty, lend
Additional parameters to
segments(), controlling line style. Uselend = "butt"(the default) ifpaletteis semitransparent, to avoid artefacts.- bty
Character specifying the type of box to be drawn around the legend. The allowed values are
"o"(the default) and"n".- cex
Character expansion factor relative to current
par("cex").- width
Vector of length two specifying width of legend bar at base and top.
- scale
Character string specifying whether
width = 1corresponds to:"pch", the size of a plotting symbol withpch = 1;"lwd", the width of a line withlwd = 1.- col
Colour used for the width bar.
Value
A list, returned invisibly, with components:
rectA list with components:w,h: positive numbers giving width and height of the legend's box.left,top: x and y coordinates of the upper left corner of the box.
text: A list with componentsx,y, numeric vectors of lengthlength(legend), giving the x and y coordinates of the legend's text(s).
Details
This convenience function is not yet very customizable; do file a GitHub issue if you would value additional functionality.
Note that the bg parameter to specify the background colour for the legend
box is not presently supported in vertical legends.
For use in vertical legends, open a GitHub issue.
Examples
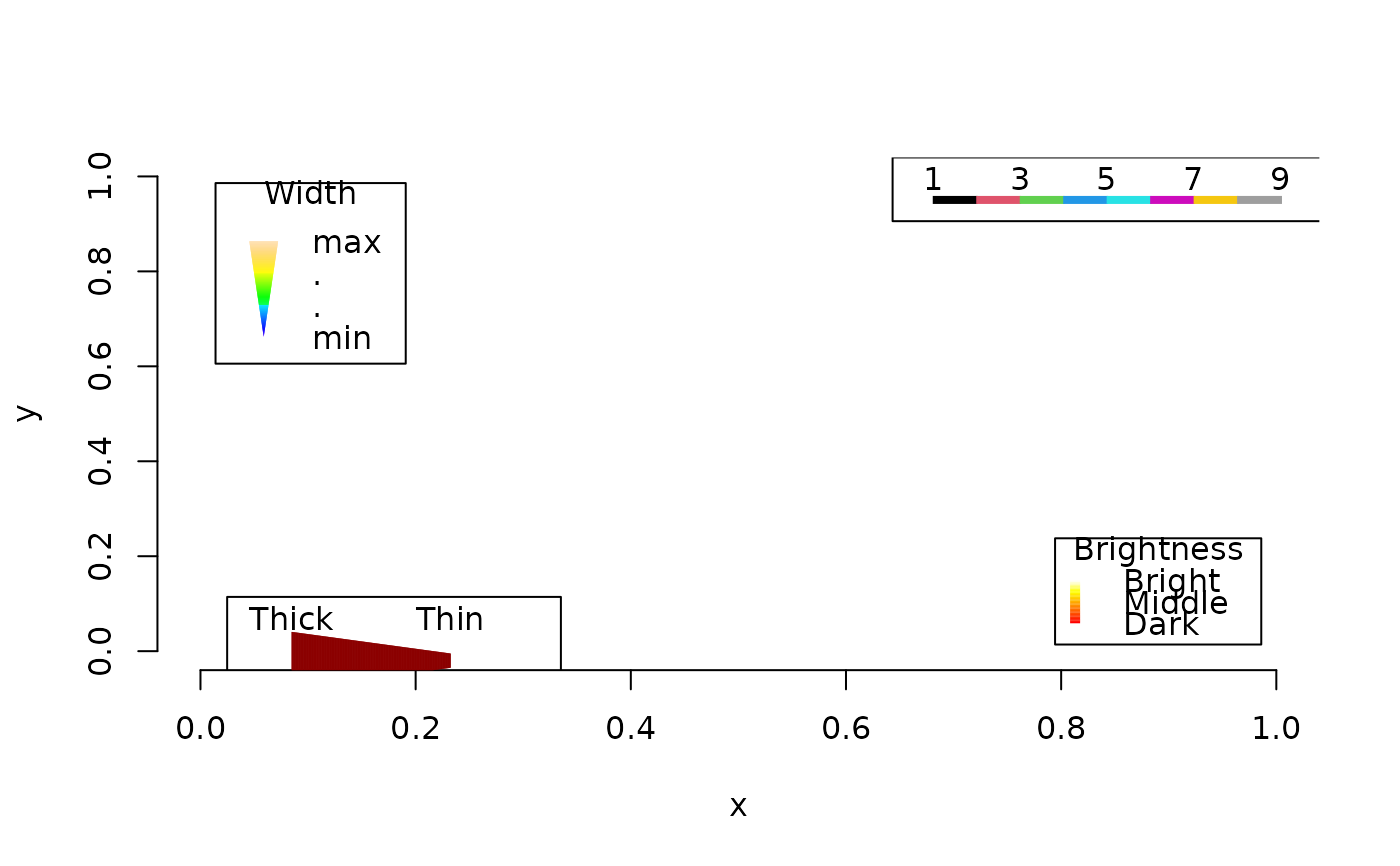
plot(0:1, 0:1, type = "n", frame.plot = FALSE,
     xlab = "x", ylab = "y")

SpectrumLegend("bottomright", legend = c("Bright", "Middle", "Dark"),
               palette = heat.colors(32L), lwd = 5,
               inset = 0.05, # Inset from plot margin
               title = "Brightness")
SpectrumLegend("topright", horiz = TRUE,
               legend = seq(1, 9, by = 2), palette = 1:8)
SizeLegend(
  "topleft", inset = 0.05, width = c(0, 2),
  title = "Width",
  legend = c("max", ".", ".", "min"),
  palette = topo.colors, # Associate with a colour scale
  y.intersp = 1.5 # Vertical space between labels (also moves title)
)
SizeLegend(
  "bottomleft", horiz = TRUE, width = c(4, 1),
  legend = c("Thick", "Thin"), palette = "darkred",
  inset = 0.06 # Make space for the bar.
               # A future release may calculate this automatically
)