Create and style a blank ternary plot.
Usage
TernaryPlot(
  atip = NULL,
  btip = NULL,
  ctip = NULL,
  alab = NULL,
  blab = NULL,
  clab = NULL,
  lab.offset = 0.16,
  lab.col = NULL,
  point = "up",
  clockwise = TRUE,
  xlim = NULL,
  ylim = NULL,
  region = ternRegionDefault,
  lab.cex = 1,
  lab.font = 0,
  tip.cex = lab.cex,
  tip.font = 2,
  tip.col = "black",
  isometric = TRUE,
  atip.rotate = NULL,
  btip.rotate = NULL,
  ctip.rotate = NULL,
  atip.pos = NULL,
  btip.pos = NULL,
  ctip.pos = NULL,
  padding = 0.08,
  col = NA,
  panel.first = NULL,
  panel.last = NULL,
  grid.lines = 10,
  grid.col = "darkgrey",
  grid.lty = "solid",
  grid.lwd = par("lwd"),
  grid.minor.lines = 4,
  grid.minor.col = "lightgrey",
  grid.minor.lty = "solid",
  grid.minor.lwd = par("lwd"),
  axis.lty = "solid",
  axis.labels = TRUE,
  axis.cex = 0.8,
  axis.font = par("font"),
  axis.rotate = TRUE,
  axis.pos = NULL,
  axis.tick = TRUE,
  axis.lwd = 1,
  ticks.lwd = axis.lwd,
  ticks.length = 0.025,
  axis.col = "black",
  ticks.col = grid.col,
  ...
)

HorizontalGrid(
  grid.lines = 10,
  grid.col = "grey",
  grid.lty = "dotted",
  grid.lwd = par("lwd"),
  direction = getOption("ternDirection", 1L)
)
Arguments
- atip, btip, ctip
Character string specifying text to title corners, proceeding clockwise from the corner specified in
point(default: top).- alab, blab, clab
Character string specifying text with which to label the corresponding sides of the triangle. Left or right-pointing arrows are produced by typing
\\U2190or\\U2192, or usingexpression('value' %->% '').- lab.offset
Numeric specifying distance between midpoint of axis label and the axis. The default value is given in the 'Usage' section; a value of
0will position the axis label directly on the axis. Increasepaddingif labels are being clipped. Use a vector of length three to specify a different offset for each label.- lab.col
Character vector specifying colours for axis labels. Use a vector of length three to specify a different colour for each label.
- point
Character string specifying the orientation of the ternary plot: should the triangle point
"up","right","down"or"left"? The integers 1 to 4 can be used in place of the character strings.- clockwise
Logical specifying the direction of axes. If
TRUE(the default), each axis runs from zero to its maximum value in a clockwise direction around the plot.- xlim, ylim
Numeric vectors of length two specifying the minimum and maximum x and y limits of the plotted area, to which
paddingwill be added. The default is to display the complete height or width of the plot. Allows cropping to magnified region of the plot. (See vignette for diagram.) May be overridden ifisometric = TRUE; see documentation ofisometricparameter.- region
(optional) Named list of length two specifying the the
minimum andmaximum values of each ternary axis to be drawn (e.g.list(min = c(40, 0, 0), max = c(100, 60, 60)); or a set of coordinates in a format accepted byTernaryPoints(). The plotted region will correspond to the smallest equilateral triangle that encompasses the specified ranges or coordinates.- lab.cex, tip.cex
Numeric specifying character expansion (font size) for axis labels. Use a vector of length three to specify a different value for each direction.
- lab.font, tip.font
Numeric specifying font style (Roman, bold, italic, bold-italic) for axis titles. Use a vector of length three to set a different font for each direction.
- isometric
Logical specifying whether to enforce an equilateral shape for the ternary plot. If only one of
xlimandylimis set, the other will be calculated to maintain an equilateral plot. If bothxlimandylimare set, but have different ranges, then the limit with the smaller range will be scaled until its range matches that of the other limit.- atip.rotate, btip.rotate, ctip.rotate
Integer specifying number of degrees to rotate label of rightmost apex.
- atip.pos, btip.pos, ctip.pos
Integer specifying positioning of labels, iff the corresponding
xtip.rotateparameter is set.- padding
Numeric specifying size of internal margin of the plot; increase if axis labels are being clipped.
- col
The colour for filling the plot; see
polygon.- panel.first
An expression to be evaluated after the plot axes are set up but before any plotting takes place. This can be useful for drawing backgrounds, e.g. with
ColourTernary()orHorizontalGrid(). Note that this works by lazy evaluation: passing this argument from other plot methods may well not work since it may be evaluated too early.- panel.last
An expression to be evaluated after plotting has taken place but before the axes and box are added. See the comments about
panel.first.- grid.lines
Integer specifying the number of grid lines to plot. If
axis.labels = TRUE, this will be used as a hint topretty().- grid.col, grid.minor.col
Colours to draw the grid lines. Use a vector of length three to set different values for each direction.
- grid.lty, grid.minor.lty
Character or integer vector; line type of the grid lines. Use a vector of length three to set different values for each direction.
- grid.lwd, grid.minor.lwd
Non-negative numeric giving line width of the grid lines. Use a vector of length three to set different values for each direction.
- grid.minor.lines
Integer specifying the number of minor (unlabelled) grid lines to plot between each major pair.
- axis.lty
Line type for both the axis line and tick marks. Use a vector of length three to set a different value for each direction.
- axis.labels
This can either be a logical value specifying whether (numerical) annotations are to be made at the tickmarks, or a character or expression vector of labels to be placed at the tick points, or a list of length three, with each entry specifying labels to be placed on each axis in turn.
- axis.cex
Numeric specifying character expansion (font size) for axis labels. Use a vector of length three to set a different value for each direction.
- axis.font
Font for text. Defaults to
par('font').- axis.rotate
Logical specifying whether to rotate axis labels to parallel grid lines, or numeric specifying custom rotation for each axis, to be passed as
srtparameter totext(). Expand margins or setpar(xpd = NA)if labels are clipped.- axis.pos
Vector of length one or three specifying position of axis labels, to be passed as
posparameter totext(); populated automatically ifNULL(the default).- axis.tick
Logical specifying whether to mark the axes with tick marks.
- axis.lwd, ticks.lwd
Line width for the axis line and tick marks. Zero or negative values will suppress the line or ticks. Use a vector of length three to set different values for each axis.
- ticks.length
Numeric specifying distance that ticks should extend beyond the plot margin. Also affects position of axis labels, which are plotted at the end of each tick. Use a vector of length three to set a different length for each direction.
- axis.col, ticks.col, tip.col
Colours for the axis line, tick marks and tip labels respectively. Use a vector of length three to set a different value for each direction.
axis.col = NULLmeans to usepar('fg'), possibly specified inline, andticks.col = NULLmeans to use whatever colouraxis.colresolved to.- ...
Additional parameters to
plot.- direction
(optional) Integer specifying the direction that the current ternary plot should point: 1, up; 2, right; 3, down; 4, left.
Details
The plot will be generated using the standard 'graphics' plot functions, on
which additional elements can be added using Cartesian coordinates, perhaps
using functions such as arrows,
legend or text.
See also
Detailed usage examples are available in the package vignette
AddToTernary(): Add elements to a ternary plotTernaryCoords(): Convert ternary coordinates to Cartesian (x and y) coordinatesTernaryXRange(),TernaryYRange(): What are the x and y limits of the plotted region?
Examples
TernaryPlot(
atip = "Top", btip = "Bottom", ctip = "Right", axis.col = "red",
col = rgb(0.8, 0.8, 0.8)
)
HorizontalGrid(grid.lines = 2, grid.col = "blue", grid.lty = 1)
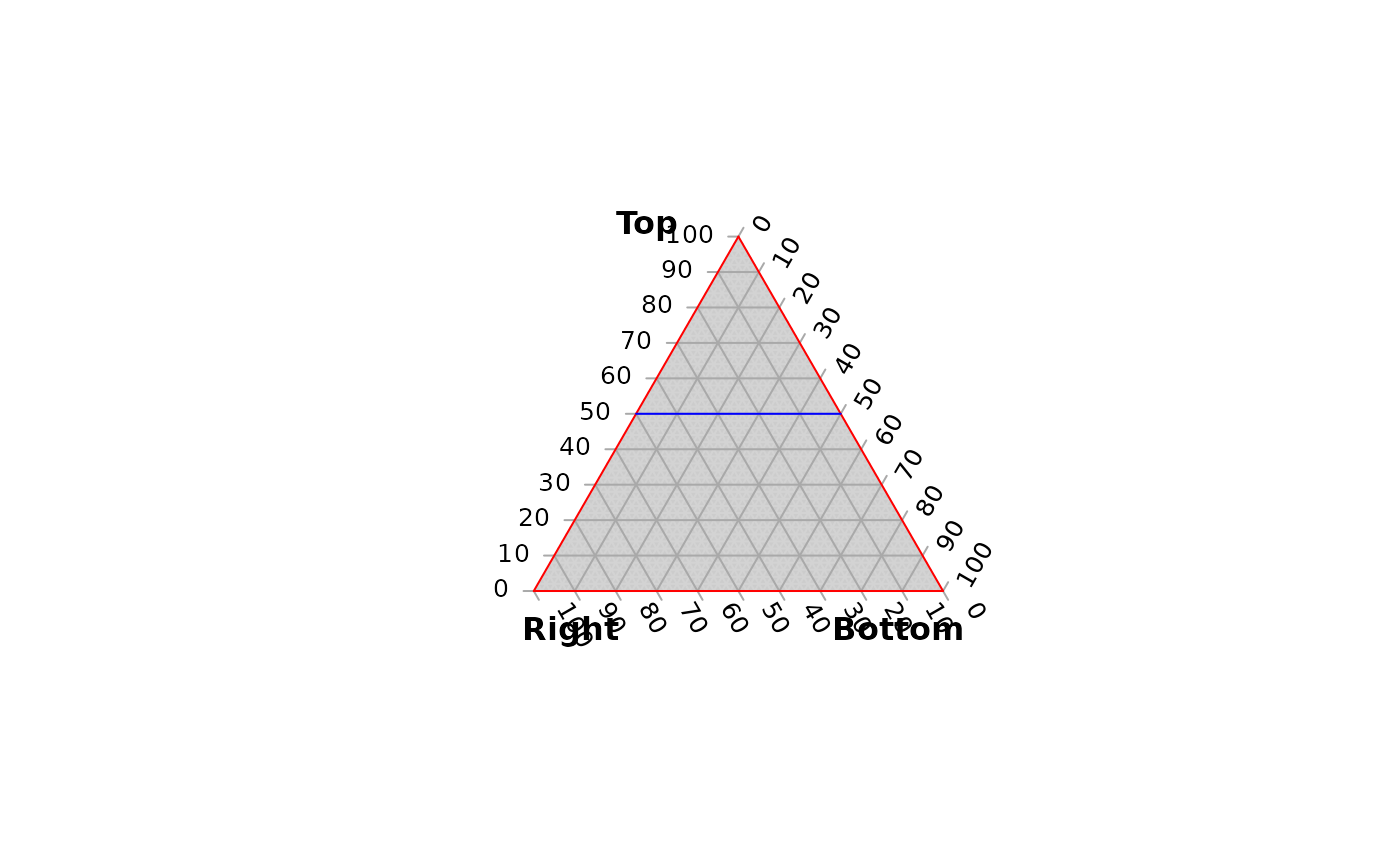 # the second line corresponds to the base of the triangle, and is not drawn