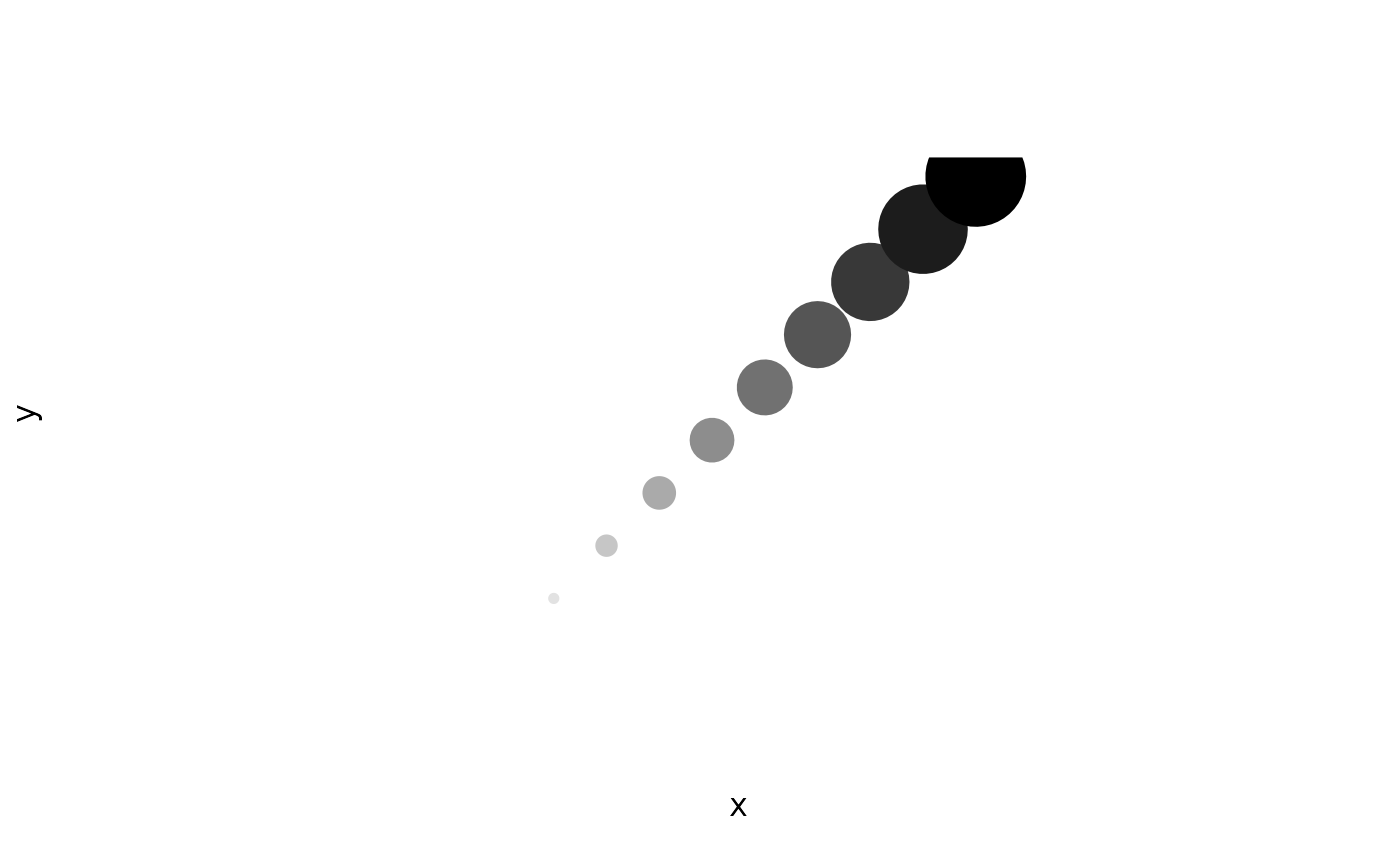
Plot3() displays three-dimensional data in two dimensions, reflecting the
third dimension with point scaling, overlap and fogging.
Points with a lower z value are smaller than, fainter than, and overlapped
by points with a higher value.
Arguments
- x, y, z
Coordinates of points to plot.
- bg, cex, col, pch, add, axes, frame.plot, ...
Parameters passed to
plot.default().- plot.bg
Colour with which to fill plot area, used as fog colour.
- fog
Numeric from zero (no fading) to one (furthest points are invisible) specifying amount to fade distant points.
- shrink
Numeric specifying degree to which size of plotted point should reflect
zposition.0denotes no scaling; if1, furthest point will have zero size.