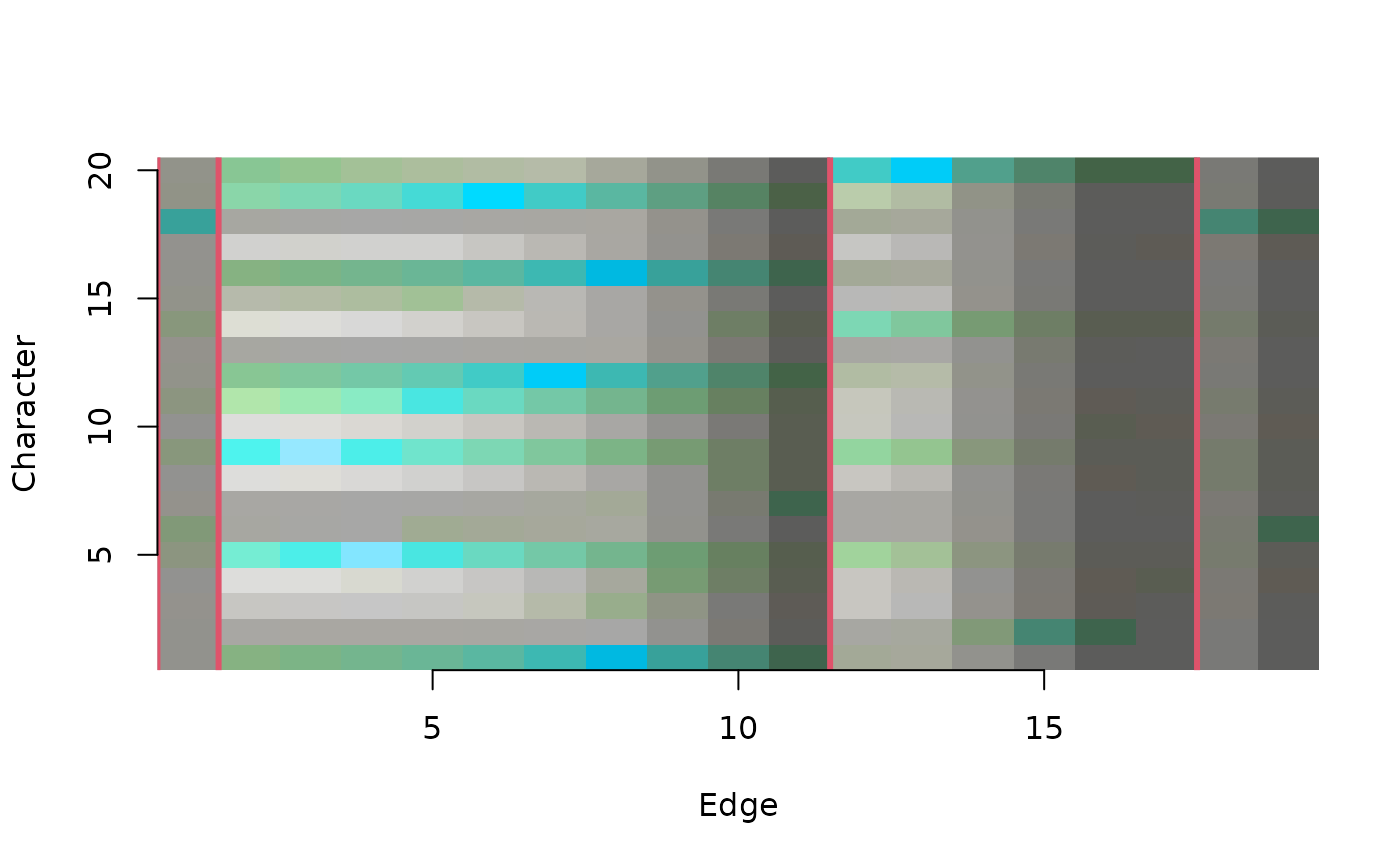
ConcordanceTable() plots a concordance table
(Smith 2026)
.
Usage
ConcordanceTable(
  tree,
  dataset,
  Col = QACol,
  largeClade = 0,
  xlab = "Edge",
  ylab = "Character",
  normalize = TRUE,
  plot = TRUE,
  marginSize = 0L,
  ...
)
Arguments
- tree
A tree of class
phylo.- dataset
A phylogenetic data matrix of phangorn class
phyDat, whose names correspond to the labels of any accompanying tree. Perhaps load into R usingReadAsPhyDat(). Additive (ordered) characters can be handled usingDecompose().- Col
Function that takes vectors
amountandqualityand returns a vector of colours. QCol colours by data quality (concordance); QACol by quality and amount of information.- largeClade
Integer; if greater than 1, vertical lines will be drawn at edges whose descendants are both contain more than
largeCladeleaves.- xlab
Character giving a label for the x axis.
- ylab
Character giving a label for the y axis.
- normalize
Controls how the expected mutual information (the zero point of the scale) is determined.
FALSE: no chance correction; MI is scaled only by its maximum.TRUE: subtract the analytical expected MI for random association.<integer>: subtract an empirical expected MI estimated from that number of random trees.
In all cases, 1 corresponds to the maximal attainable MI for the pair (
hBest), and 0 corresponds to the chosen expectation.- plot
Logical specifying whether to draw the plot.
- marginSize
Integer scalar or vector controlling summary margin strips. If a scalar (length 1) and greater than zero, both a left strip and a bottom strip are added, each
marginSizegrid cells wide/tall. If a vector (length > 1), each entry controls one side following the usualpar(mar)order —c(bottom, left, top, right)— where a positive value enables that strip with the given width/height andNAor0suppresses it. Currently only the bottom (entry 1) and left (entry 2) strips are implemented; further entries are accepted but ignored. The left strip is coloured by the characterwise concordance (weighted mean across edges); the bottom strip by the edgewise concordance (weighted mean across characters). One blank cell separates each strip from the main grid.- ...
Arguments to
abline, to control the appearance of vertical lines marking important edges.
Value
ConcordanceTable() invisibly returns an named list containing:
"info": The amount of information in each character-edge pair, in bits;"relInfo": The information, normalized to the most information-rich pair;"quality": The normalized mutual information of the pair;"col": The colours used to plot the table.
References
Smith MR (2026). “Which characters support which clades? Exploring the distribution of phylogenetic signal using mutual information.” Systematic Biology, Under review.
See also
SiteConcordance(): compute underlying concordance values.
Other split support functions:
JackLabels(),
Jackknife(),
MaximizeParsimony(),
MostContradictedFreq(),
PresCont(),
SiteConcordance
Examples
# Load data and tree
data("congreveLamsdellMatrices", package = "TreeSearch")
dataset <- congreveLamsdellMatrices[[1]][, 1:20]
tree <- referenceTree
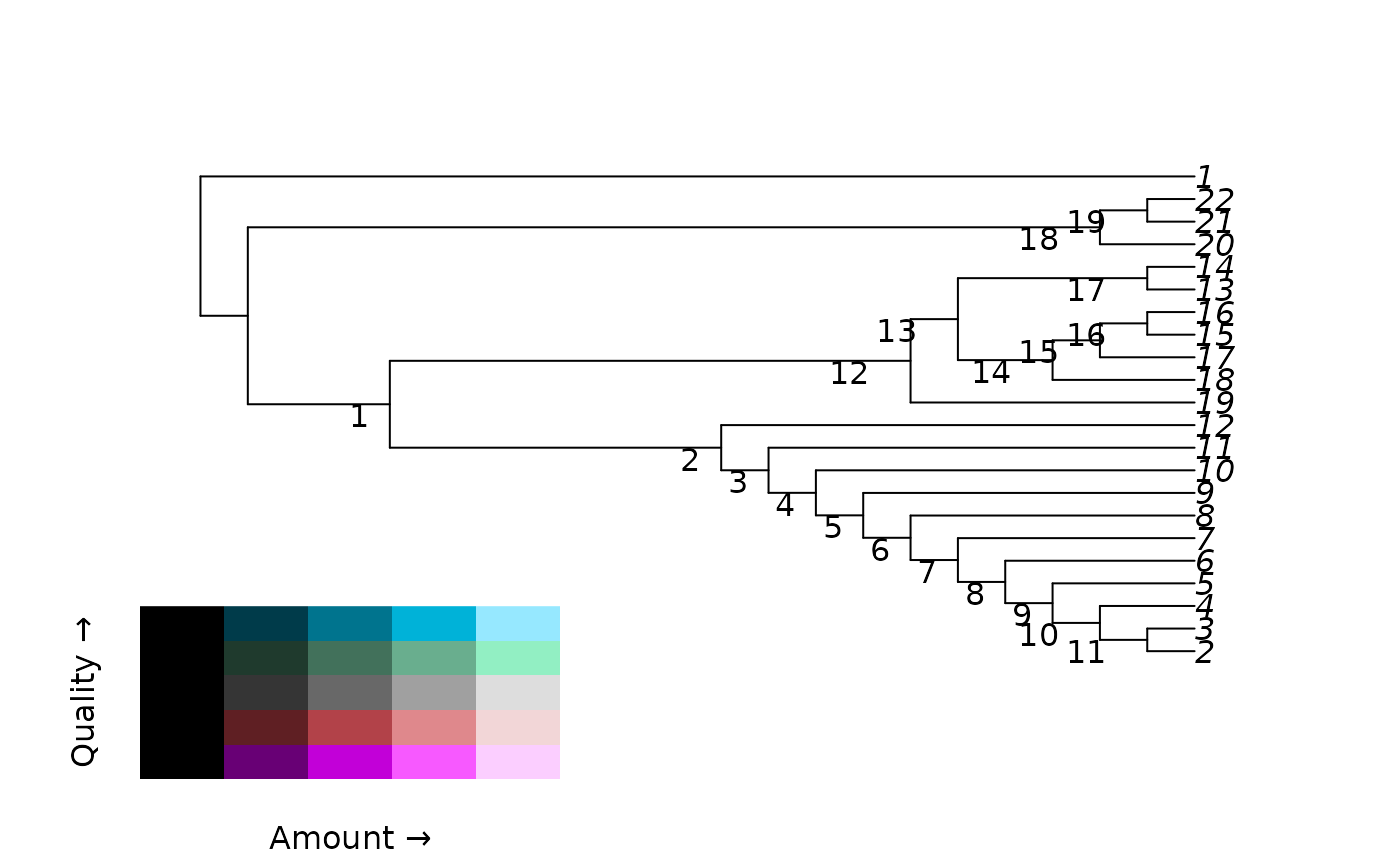
# Plot tree and identify nodes
library("TreeTools", quietly = TRUE)
plot(tree)
nodeIndex <- as.integer(rownames(as.Splits(tree)))
nodelabels(seq_along(nodeIndex), nodeIndex, adj = c(2, 1),
frame = "none", bg = NULL)
QALegend(where = c(0.1, 0.4, 0.1, 0.3))
 # View information shared by characters and edges
ConcordanceTable(tree, dataset, largeClade = 3, col = 2, lwd = 3,
marginSize = 1:4)
axis(1)
axis(2)
# View information shared by characters and edges
ConcordanceTable(tree, dataset, largeClade = 3, col = 2, lwd = 3,
marginSize = 1:4)
axis(1)
axis(2)
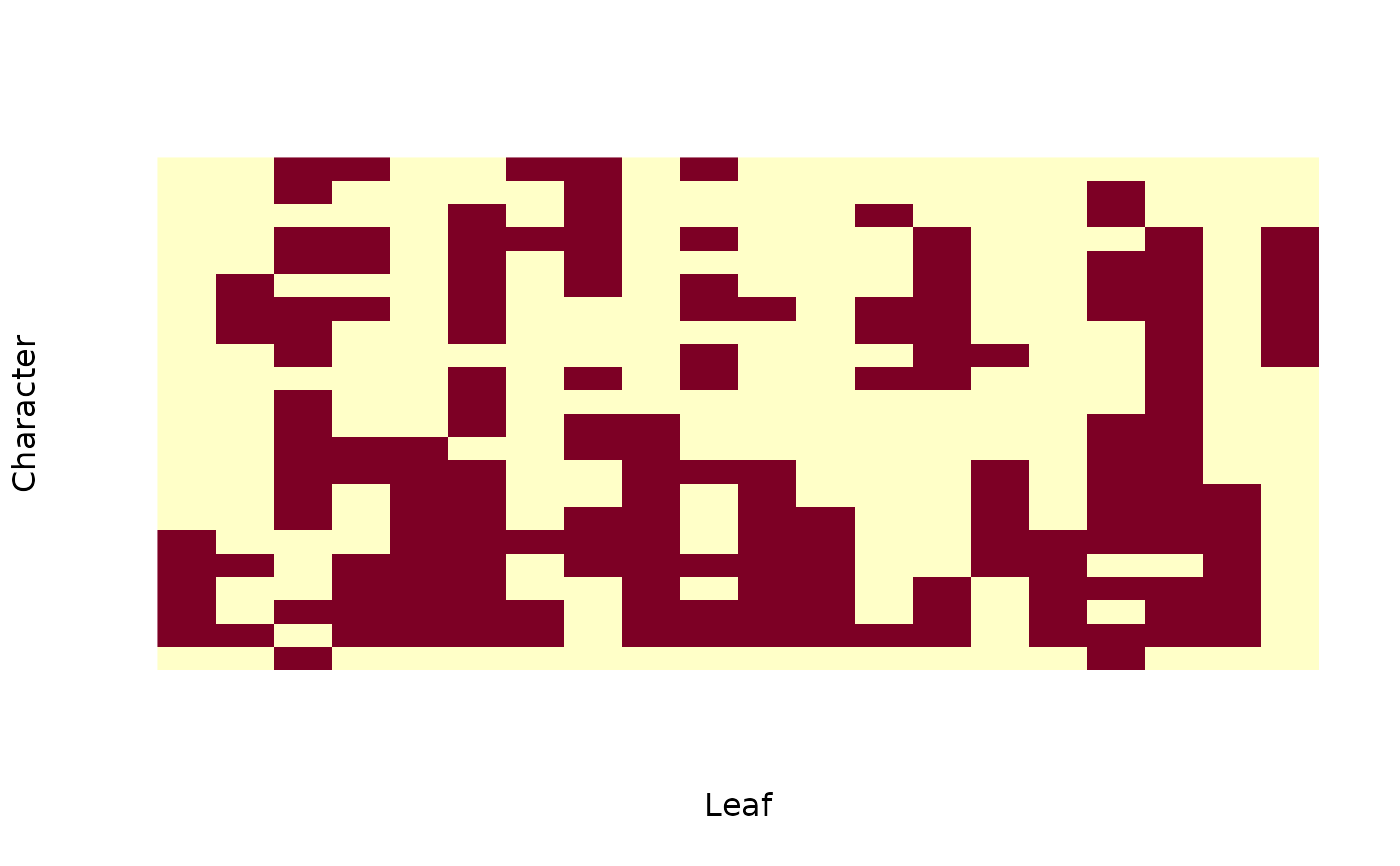
 # Visualize dataset
image(t(`mode<-`(PhyDatToMatrix(dataset), "numeric")), axes = FALSE,
xlab = "Leaf", ylab = "Character")
# Visualize dataset
image(t(`mode<-`(PhyDatToMatrix(dataset), "numeric")), axes = FALSE,
xlab = "Leaf", ylab = "Character")