Generate colour to depict the amount and quality of observations
Usage
QACol(amount, quality)

QCol(amount, quality)

QALegend(where = c(0.1, 0.3, 0.1, 0.3), n = 5, Col = QACol)
Arguments
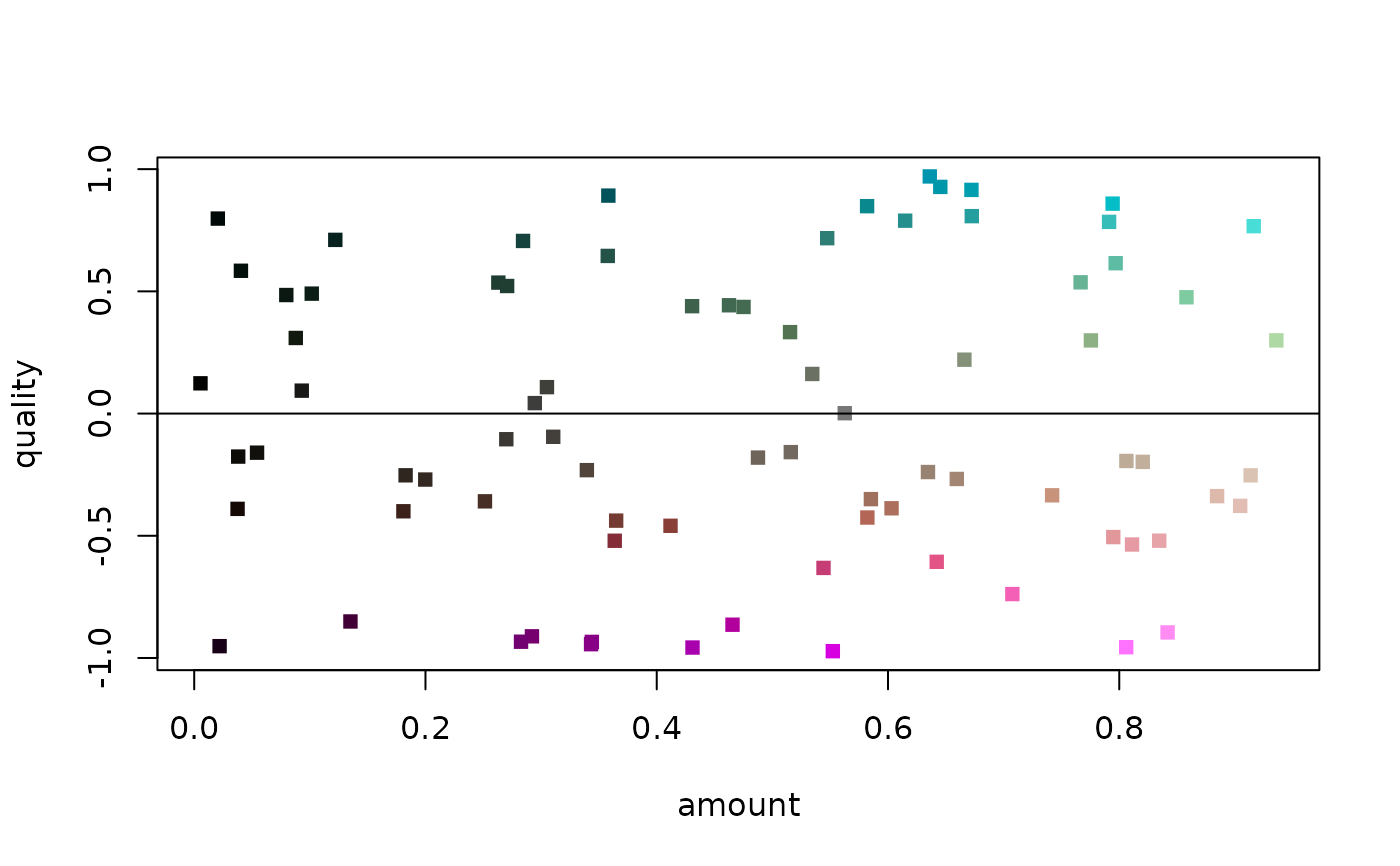
- amount
Numeric vector of values between 0 and 1, denoting the relative amount of information
- quality
Numeric vector of values between -1 and 1, denoting the quality of observations, where 0 is neutral.
- where
Location of legend, passed to
par(fig = where)- n
Integer vector giving number of cells to plot in swatch for
qualityandamount.- Col
Function that takes vectors
amountandqualityand returns a vector of colours. QCol colours by data quality (concordance); QACol by quality and amount of information.
Value
QACol() returns an RGB hex code for a colour, where lighter colours
correspond to entries with a higher amount; unsaturated colours denote
a neutral quality; and red/cyan colours denote low/high quality.
QCol() returns an RGB hex code for a colour, where darker,
unsaturated colours denote a neutral quality;
and red/cyan colours denote low/high quality. amount is ignored.
See also
Other utility functions:
ClusterStrings(),
QuartetResolution(),
WhenFirstHit()