Draws contour lines to depict the value of a function in ternary space.
Usage
TernaryContour(
  Func,
  resolution = 96L,
  direction = getOption("ternDirection", 1L),
  region = getOption("ternRegion", ternRegionDefault),
  within = NULL,
  filled = FALSE,
  legend,
  legend... = list(),
  nlevels = 10,
  levels = pretty(zlim, nlevels),
  zlim,
  color.palette = function(n) hcl.colors(n, palette = "viridis", alpha = 0.6),
  fill.col = color.palette(length(levels) - 1),
  func... = list(),
  ...
)
Arguments
- Func
Function that takes three arguments named
a,bandc, and returns a numeric vector of length n.a,bandcwill each be a vector of length n. Together, they specify the series of coordinates at which the function should be evaluated.- resolution
The number of triangles whose base should lie on the longest axis of the triangle. Higher numbers will result in smaller subdivisions and smoother colour gradients, but at a computational cost.
- direction
(optional) Integer specifying the direction that the current ternary plot should point: 1, up; 2, right; 3, down; 4, left.
- region
(optional) Named list of length two specifying the the
minimum andmaximum values of each ternary axis to be drawn (e.g.list(min = c(40, 0, 0), max = c(100, 60, 60)); or a set of coordinates in a format accepted byTernaryPoints(). The plotted region will correspond to the smallest equilateral triangle that encompasses the specified ranges or coordinates.- within
List or matrix of x, y coordinates within which contours should be evaluated, in any format supported by
xy.coords(x = within). IfNULL, defaults to a region slightly smaller than the ternary plot. The$hullentry generated byTriangleInHull()may also be used.- filled
Logical; if
TRUE, contours will be filled (using.filled.contour().).- legend
Character vector specifying annotations for colour scale. If not provided, no colour legend is displayed. Specify
TRUEto generate automatically, or a single integer to generatelegendannotations.- legend...
List of additional parameters to send to
SpectrumLegend().- nlevels, levels, zlim, ...
parameters to pass to
contour().- color.palette
parameters to pass to
.filled.contour().- fill.col
Sent as
colparameter to.filled.contour(). Computed fromcolor.paletteif not specified.- func...
List of additional parameters to send to
Func().
Value
TernaryContour() is called for its side effect – adding contours
to a Ternary plot according to the value of Func(a, b, c) at each
coordinate.
It invisibly returns a list containing:
x,y: the Cartesian coordinates of each evaluated point;z: The value ofFunc()at each coordinate.
See also
Other contour plotting functions:
ColourTernary(),
TernaryDensityContour(),
TernaryPointValues()
Examples
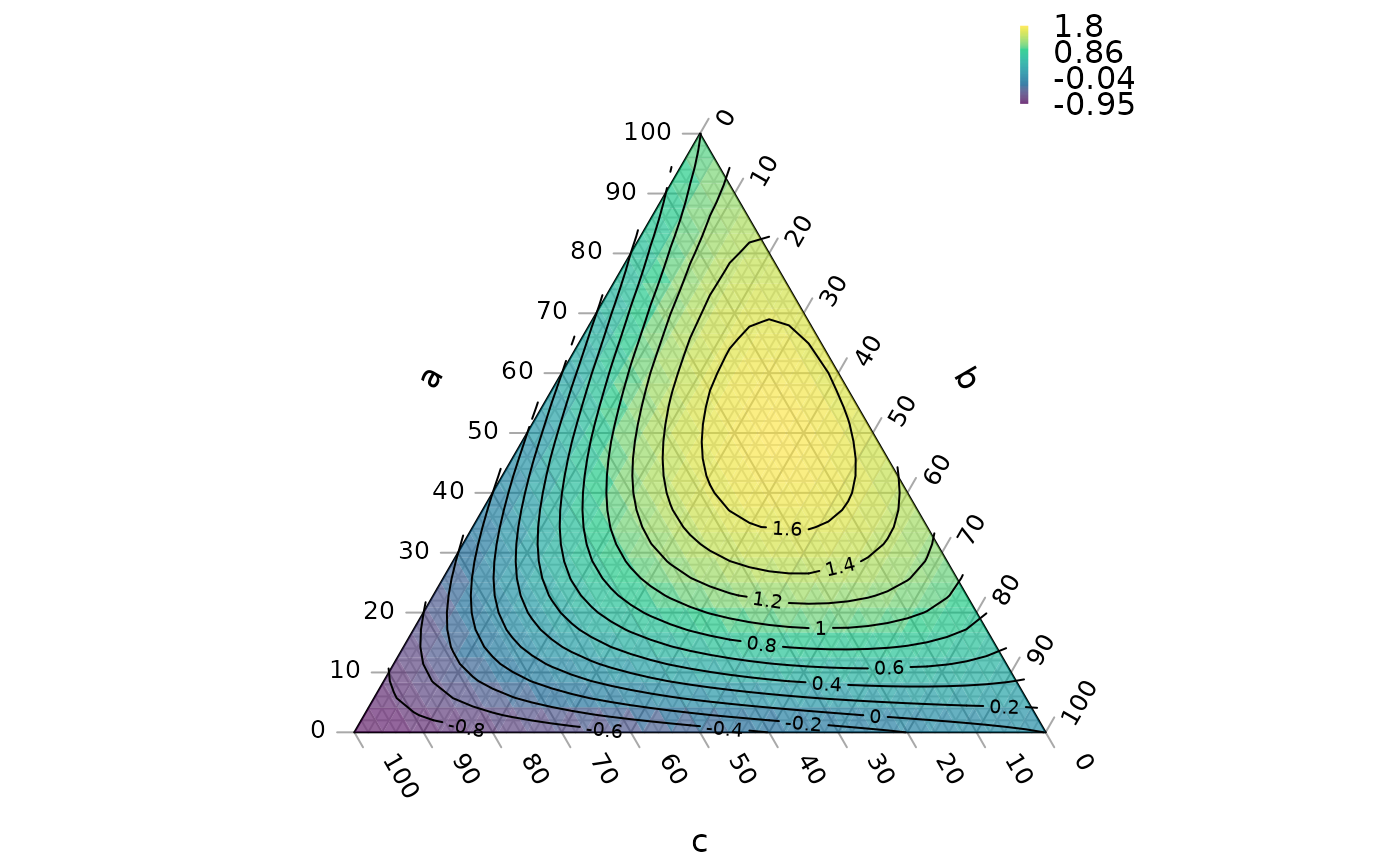
FunctionToContour <- function (a, b, c) {
a - c + (4 * a * b) + (27 * a * b * c)
}
# Set up plot
originalPar <- par(mar = rep(0, 4))
TernaryPlot(alab = "a", blab = "b", clab = "c")
values <- TernaryPointValues(FunctionToContour, resolution = 24L)
ColourTernary(
values,
legend = signif(seq(max(values), min(values), length.out = 4), 2),
bty = "n"
)
TernaryContour(FunctionToContour, resolution = 36L)
 # Note that FunctionToContour() is sent vectors of all values of a, b and
# c at which it will be evaluated.
# Instead of
BadMax <- function (a, b, c) {
max(a, b, c) # Not vectorized
# Will return the single maximum of ALL a, b and c coordinates
}
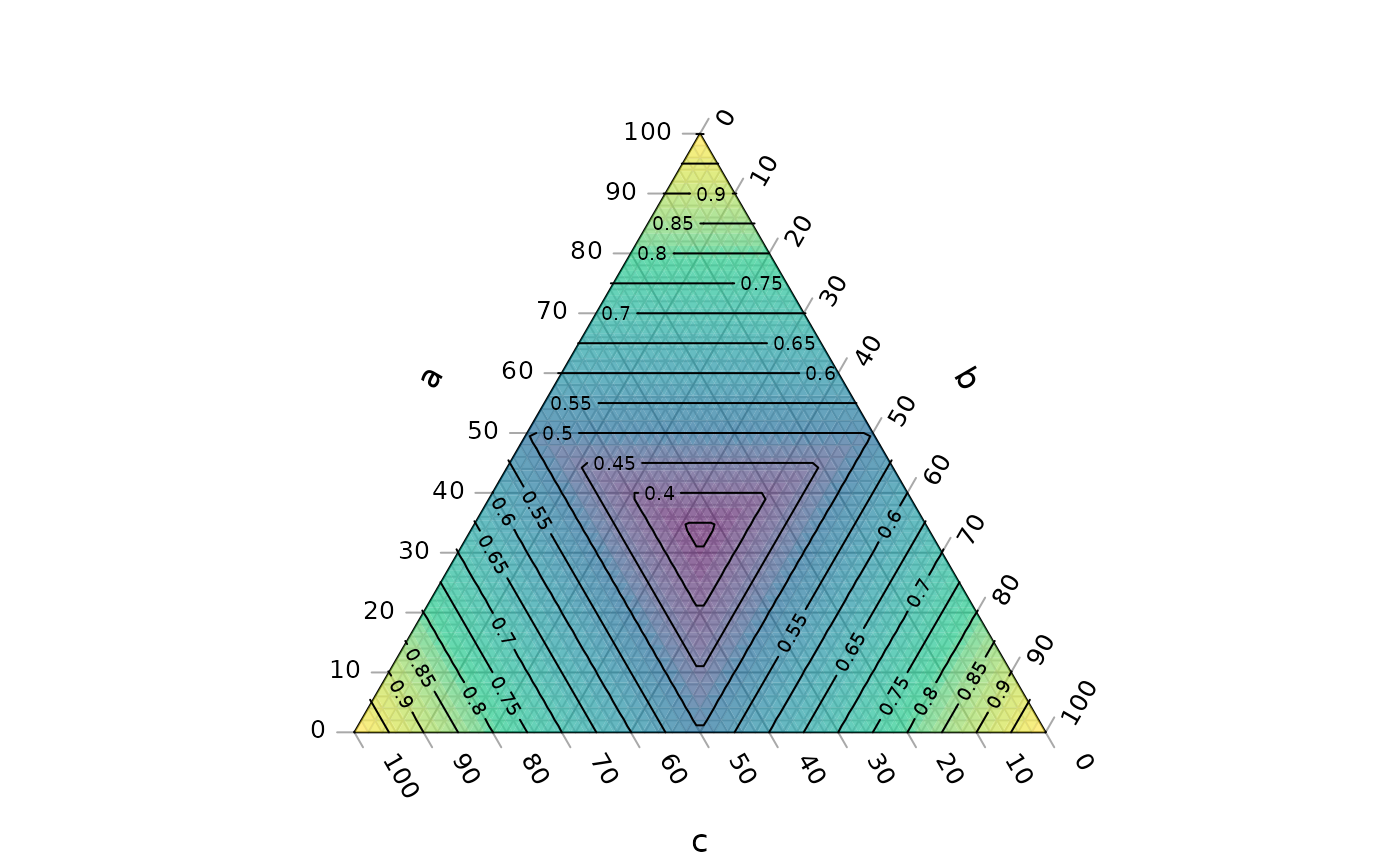
# Use
GoodMax <- function (a, b, c) {
pmax(a, b, c) # Vectorized
# Will return the maximum of each trio of a, b and c coordinates
}
TernaryPlot(alab = "a", blab = "b", clab = "c")
ColourTernary(TernaryPointValues(GoodMax))
TernaryContour(GoodMax)
# Note that FunctionToContour() is sent vectors of all values of a, b and
# c at which it will be evaluated.
# Instead of
BadMax <- function (a, b, c) {
max(a, b, c) # Not vectorized
# Will return the single maximum of ALL a, b and c coordinates
}
# Use
GoodMax <- function (a, b, c) {
pmax(a, b, c) # Vectorized
# Will return the maximum of each trio of a, b and c coordinates
}
TernaryPlot(alab = "a", blab = "b", clab = "c")
ColourTernary(TernaryPointValues(GoodMax))
TernaryContour(GoodMax)
 # When a vectorized version of a function is not available, you will need to
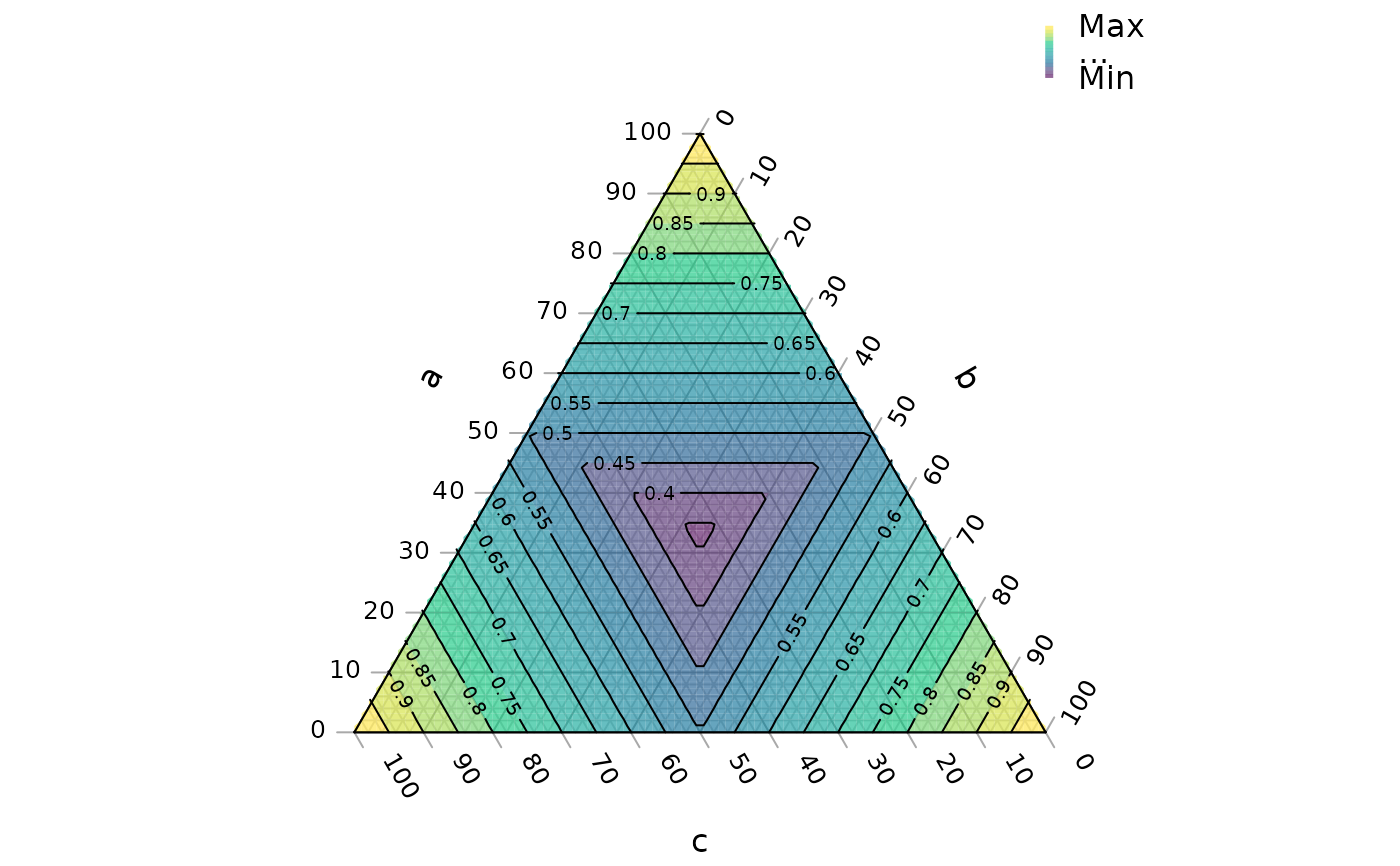
# apply the function to each combination of a, b and c in turn:
GeneralMax <- function (a, b, c) {
abc.matrix <- rbind(a, b, c) # Matrix where each column gives an a,b,c trio
apply(abc.matrix, 2, max) # Apply non-vectorized function to each trio
# Returns a vector with the maximum value of a,b,c at each coordinate.
}
TernaryPlot(alab = "a", blab = "b", clab = "c")
# Fill the contour areas, rather than using tiles
TernaryContour(GeneralMax, filled = TRUE,
legend = c("Max", "...", "Min"),
legend... = list(bty = "n", xpd = NA), # Tweak legend display
fill.col = hcl.colors(14, palette = "viridis", alpha = 0.6))
# Re-draw edges of plot triangle over fill
TernaryPolygon(diag(3))
# When a vectorized version of a function is not available, you will need to
# apply the function to each combination of a, b and c in turn:
GeneralMax <- function (a, b, c) {
abc.matrix <- rbind(a, b, c) # Matrix where each column gives an a,b,c trio
apply(abc.matrix, 2, max) # Apply non-vectorized function to each trio
# Returns a vector with the maximum value of a,b,c at each coordinate.
}
TernaryPlot(alab = "a", blab = "b", clab = "c")
# Fill the contour areas, rather than using tiles
TernaryContour(GeneralMax, filled = TRUE,
legend = c("Max", "...", "Min"),
legend... = list(bty = "n", xpd = NA), # Tweak legend display
fill.col = hcl.colors(14, palette = "viridis", alpha = 0.6))
# Re-draw edges of plot triangle over fill
TernaryPolygon(diag(3))
 # Restore plotting parameters
par(originalPar)
# Restore plotting parameters
par(originalPar)