Calculate x and y coordinates of the midpoints of triangles tiled to cover a ternary plot.
Usage
TriangleCentres(resolution = 48L, direction = getOption("ternDirection", 1L))Arguments
- resolution
The number of triangles whose base should lie on the longest axis of the triangle. Higher numbers will result in smaller subdivisions and smoother colour gradients, but at a computational cost.
- direction
(optional) Integer specifying the direction that the current ternary plot should point: 1, up; 2, right; 3, down; 4, left.
Value
TriangleCentres() returns a matrix with three named rows:
xx coordinates of triangle midpoints;yy coordinates of triangle midpoints;triDown0for upwards-pointing triangles,1for downwards-pointing.
See also
Add triangles to a plot: TernaryTiles()
Other coordinate translation functions:
ReflectedEquivalents(),
TernaryCoords(),
XYToTernary()
Other tiling functions:
TriangleInHull()
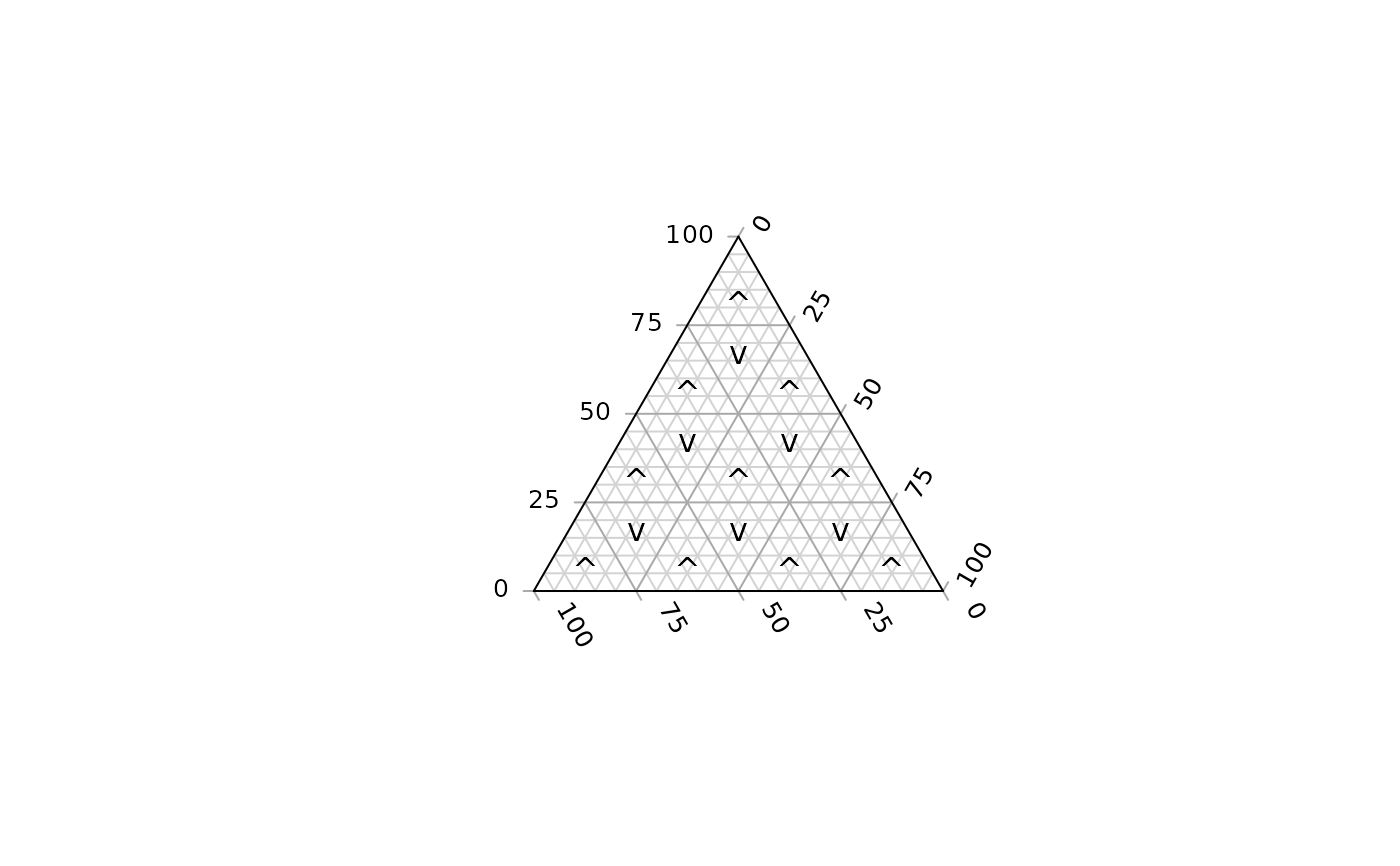
Examples
TernaryPlot(grid.lines = 4)
centres <- TriangleCentres(4)
text(centres["x", ], centres["y", ], ifelse(centres["triDown", ], "v", "^"))