Function to fill a ternary plot with coloured tiles. Useful in combination with
TernaryPointValues() and TernaryContour().
Usage
TernaryTiles(
  x,
  y,
  down,
  resolution,
  col,
  direction = getOption("ternDirection", 1L)
)
Arguments
- x, y
Numeric vectors specifying x and y coordinates of centres of each triangle.
- down
Logical vector specifying
TRUEif each triangle should point down (or right),FALSEotherwise.- resolution
The number of triangles whose base should lie on the longest axis of the triangle. Higher numbers will result in smaller subdivisions and smoother colour gradients, but at a computational cost.
- col
Vector specifying the colour with which to fill each triangle.
- direction
(optional) Integer specifying the direction that the current ternary plot should point: 1, up; 2, right; 3, down; 4, left.
Value
TernaryTiles() is called for its side effect – painting a ternary
plot with coloured tiles. It invisibly returns NULL.
See also
Other functions for colouring and shading:
ColourTernary()
Examples
TernaryPlot()
TernaryXRange()
#> [1] -0.5 0.5
TernaryYRange()
#> [1] -0.0669873 0.9330127
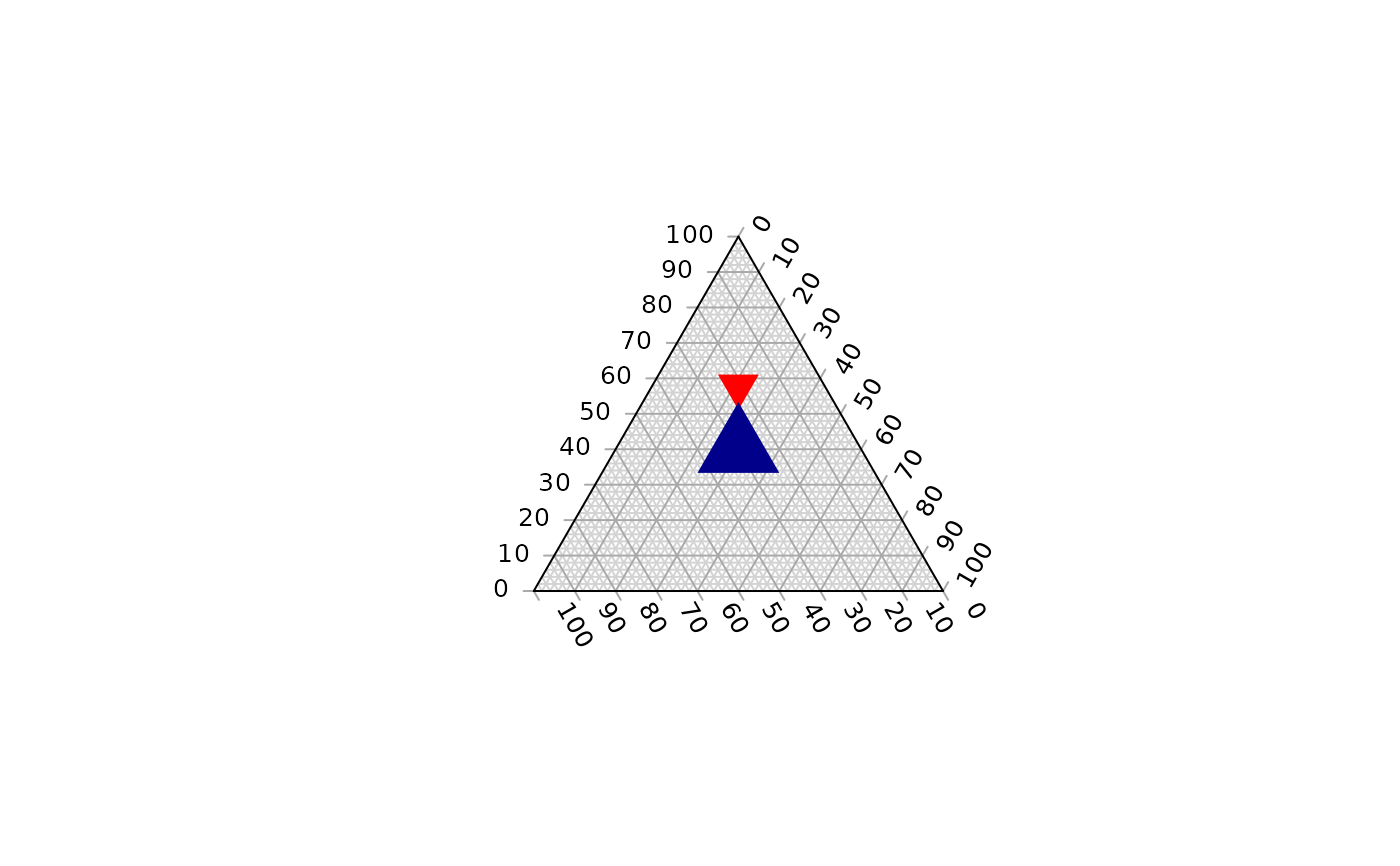
TernaryTiles(0, 0.5, TRUE, 10, "red")
xy <- TernaryCoords(c(4, 3, 3))
TernaryTiles(xy[1], xy[2], FALSE, 5, "darkblue")