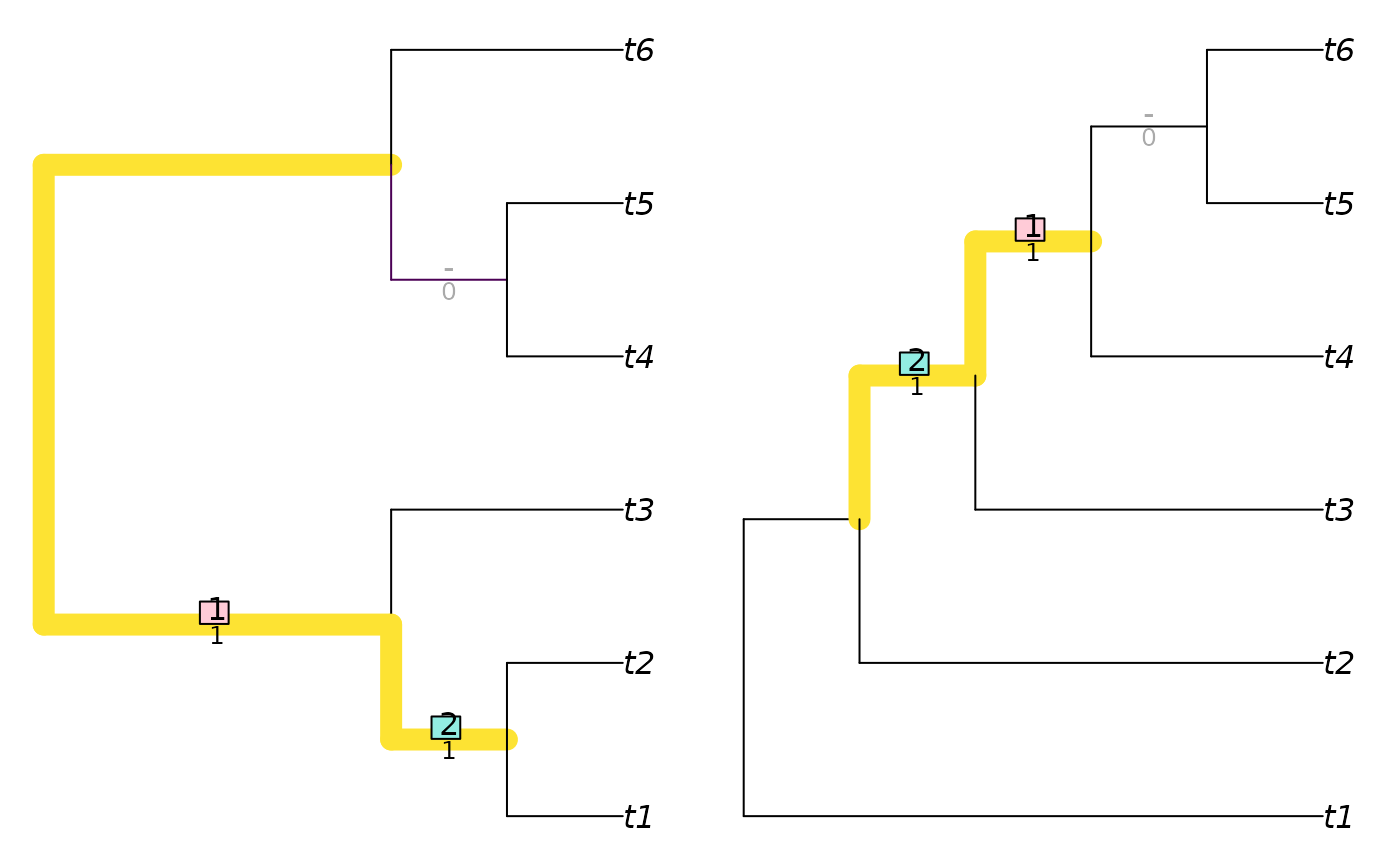
Depict the splits that are matched between two trees using a specified Generalized Robinson–Foulds similarity measure.
Usage
VisualizeMatching(
  Func,
  tree1,
  tree2,
  setPar = TRUE,
  precision = 3L,
  Plot = plot.phylo,
  matchZeros = TRUE,
  plainEdges = FALSE,
  edge.cex = par("cex"),
  value.cex = edge.cex * 0.8,
  edge.frame = "rect",
  edge.width = 1,
  edge.color = "black",
  ...
)
Arguments
- Func
Function used to construct tree similarity.
- tree1, tree2
Trees of class
phylo, with identical leaf labels.- setPar
Logical specifying whether graphical parameters should be set to display trees side by side.
- precision
Integer specifying number of significant figures to display when reporting matching scores.
- Plot
Function to use to plot trees.
- matchZeros
Logical specifying whether to pair splits with zero similarity (
TRUE), or leave them unpaired (FALSE).- plainEdges
Logical specifying whether to plot edges with a uniform width and colour (
TRUE), or whether to draw edge widths according to the similarity of the associated splits (FALSE).- edge.cex
Character expansion for edge labels. If
FALSE, suppress edge labels.- value.cex
Character expansion for values on edge labels. If
FALSE, values are not displayed.- edge.frame
Character specifying the kind of frame to be printed around the text of the edge labels. Choose an abbreviation of
"rect","circle", or"none".- edge.width, edge.color, ...
Additional parameters to send to
Plot().
Value
VisualizeMatching() invisibly returns the matching of splits
between tree1 and tree2 (i.e.
Func(tree1, tree2, reportMatching = TRUE))
Details
Note that when visualizing a Robinson–Foulds distance (using
Func = RobinsonFouldsMatching), matched splits are assigned a similarity
score of 1, which is deducted from the total number of splits to calculate
the Robinson–Foulds distance. Unmatched splits thus contribute one to
total tree distance.
Examples
tree1 <- TreeTools::BalancedTree(6)
tree2 <- TreeTools::PectinateTree(6)
VisualizeMatching(RobinsonFouldsMatching, tree1, tree2)
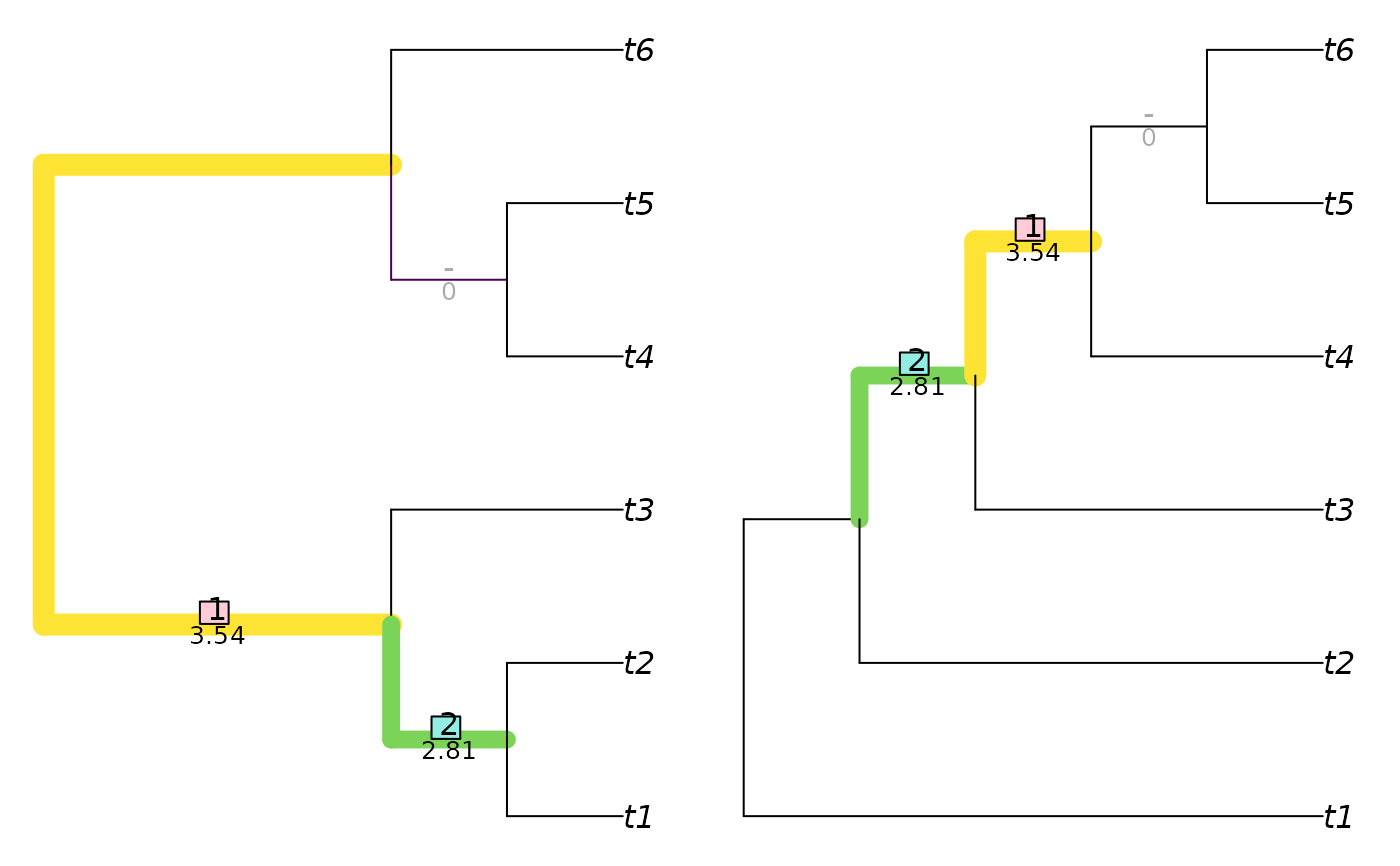
 matching <- VisualizeMatching(SharedPhylogeneticInfo, tree1, tree2,
matchZeros = FALSE)
matching <- VisualizeMatching(SharedPhylogeneticInfo, tree1, tree2,
matchZeros = FALSE)
 attributes(matching)
#> $matching
#> [1] 2 1 3
#>
#> $matchedSplits
#> [1] "t1 t2 t3 | t4 t5 t6 => t4 t5 t6 | t1 t2 t3"
#> [2] "t1 t2 | t3 t4 t5 t6 => t3 t4 t5 t6 | t1 t2"
#> [3] "t4 t5 | t1 t2 t3 t6 .. t5 t6 | t1 t2 t3 t4"
#>
#> $matchedScores
#> [1] 3.544321 2.807355 0.000000
#>
#> $pairScores
#> [,1] [,2] [,3]
#> [1,] 1.2223924 3.544321 1.2223924
#> [2,] 2.8073549 1.222392 0.4854268
#> [3,] 0.4854268 1.222392 0.0000000
#>
attributes(matching)
#> $matching
#> [1] 2 1 3
#>
#> $matchedSplits
#> [1] "t1 t2 t3 | t4 t5 t6 => t4 t5 t6 | t1 t2 t3"
#> [2] "t1 t2 | t3 t4 t5 t6 => t3 t4 t5 t6 | t1 t2"
#> [3] "t4 t5 | t1 t2 t3 t6 .. t5 t6 | t1 t2 t3 t4"
#>
#> $matchedScores
#> [1] 3.544321 2.807355 0.000000
#>
#> $pairScores
#> [,1] [,2] [,3]
#> [1,] 1.2223924 3.544321 1.2223924
#> [2,] 2.8073549 1.222392 0.4854268
#> [3,] 0.4854268 1.222392 0.0000000
#>