3.1.7: Consistent cluster recovery
Source:vignettes/06-lin-cluster-recovery.Rmd
06-lin-cluster-recovery.Rmd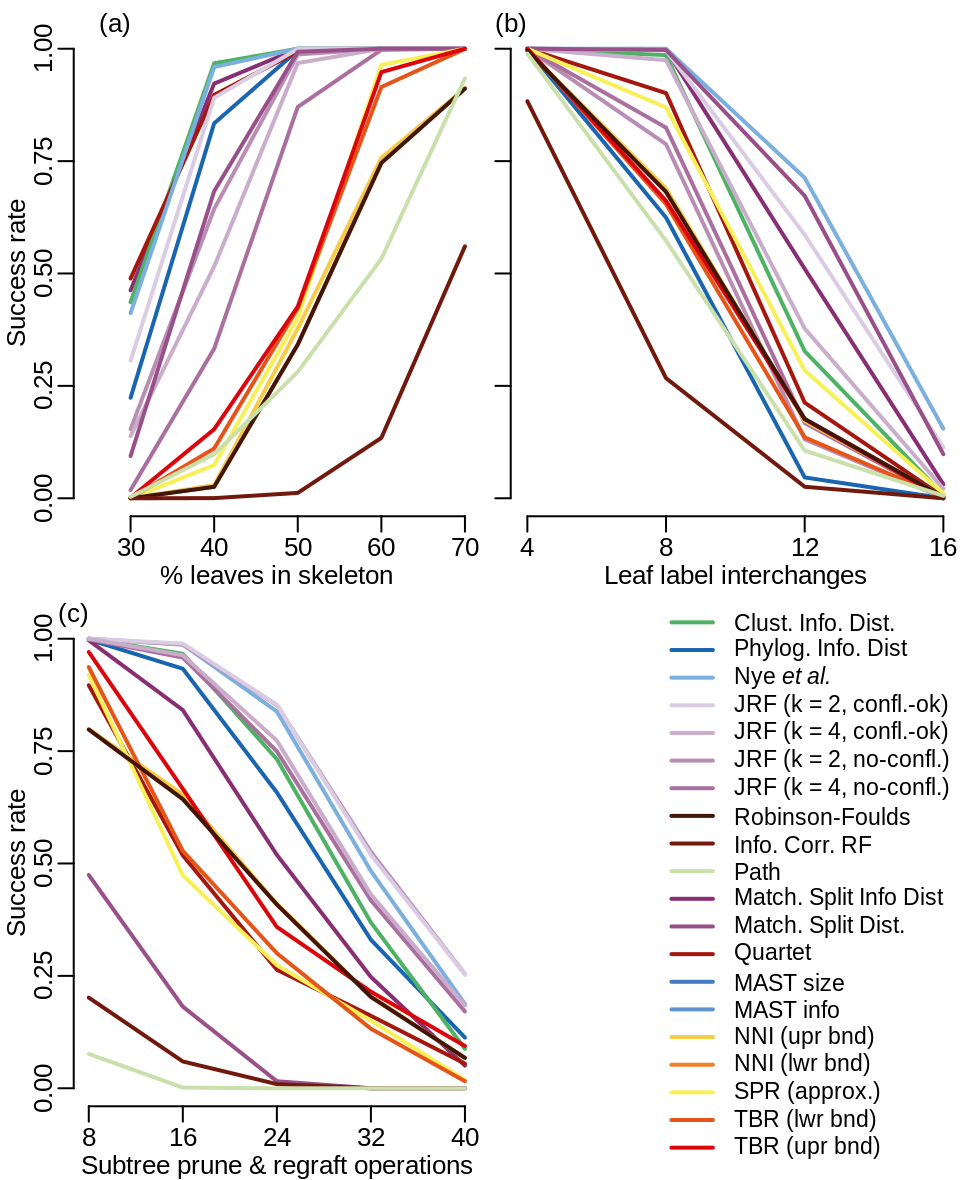
Figure 2. Cluster recovery results. Successful cluster recovery rate for each tree distance metric under (a), test one: add 40 – k leaves to two k-leaf skeletons; (b), test two: conduct k LLI operations on two 40-leaf skeletons; (c), test three: conduct k SPR operations on two 40-leaf skeletons.