Figure
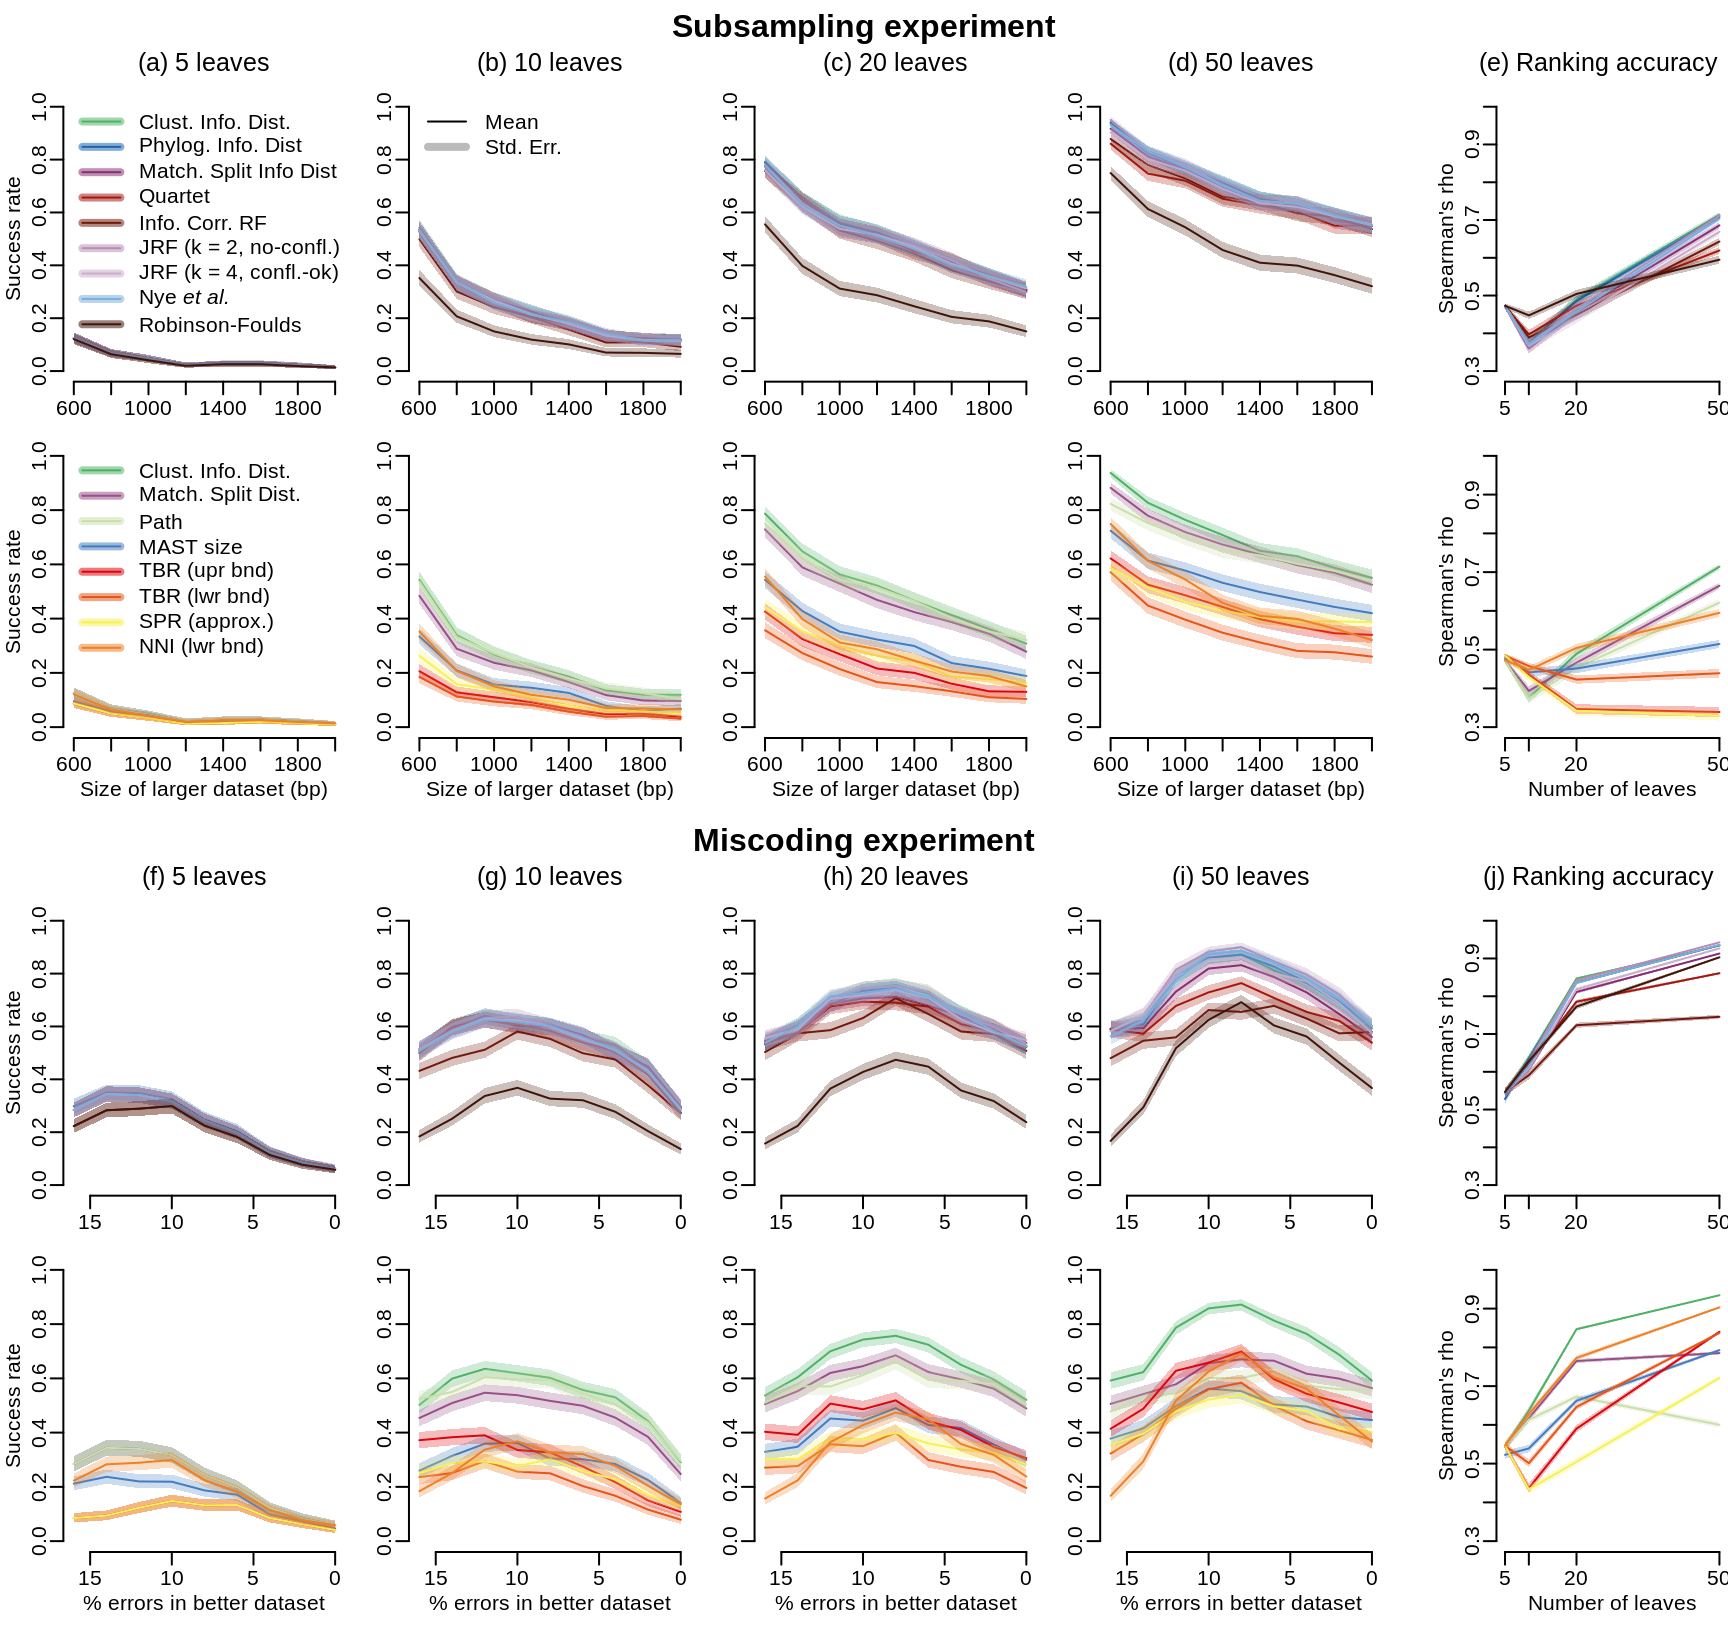
Figure 3. Results of ‘bullseye’ test. (a–d), success rate for each tree distance metric when comparing pairs of datasets differing in size by 400 base pairs; (f–i), success rates when comparing pairs of datasets differing by 2% in proportion of erroneous tokens; (e, j), accuracy of each method in ranking trees inferred from progressively degraded datasets according to the degree of dataset degradation.