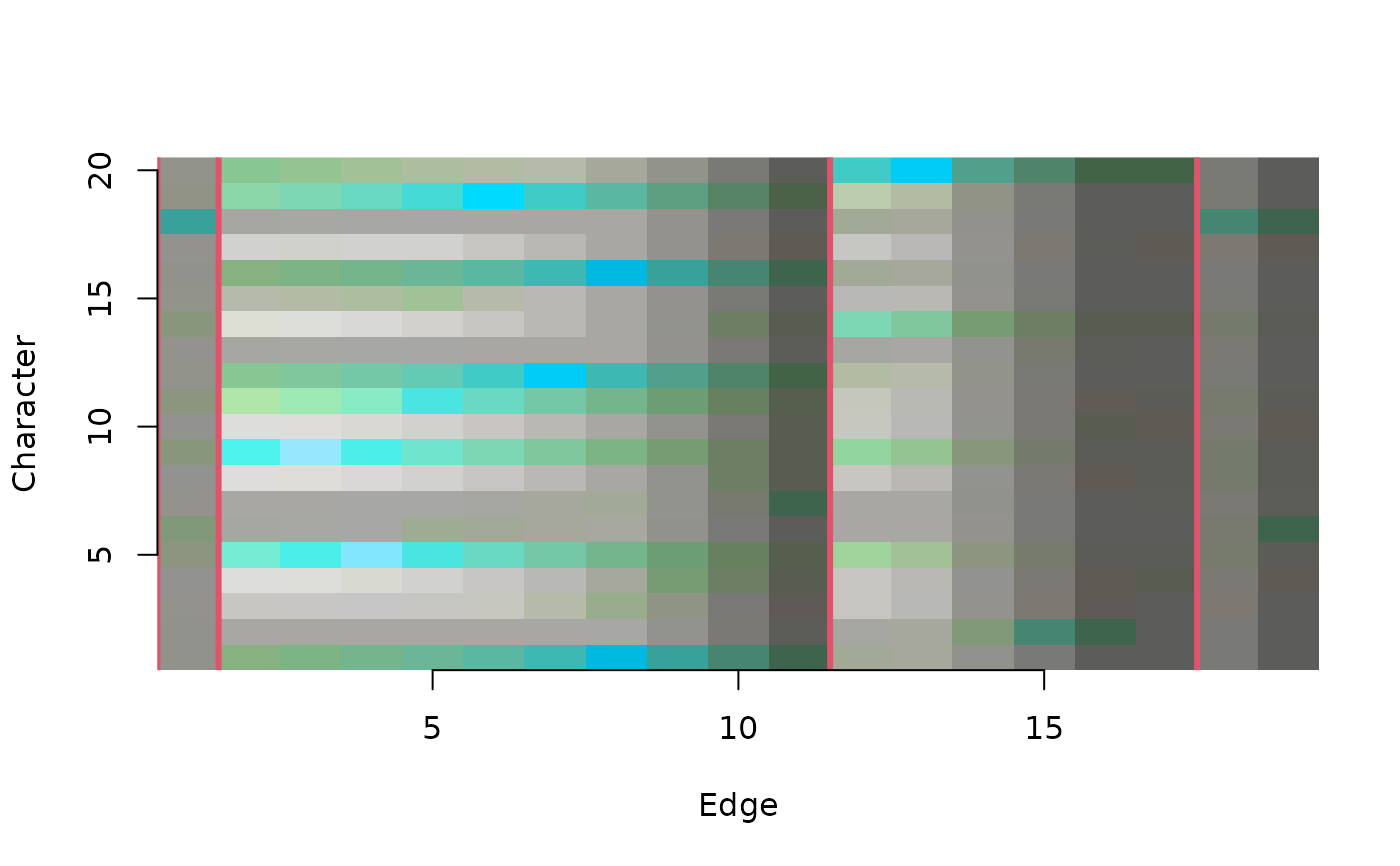
ConcordanceTable() plots a concordance table
(Smith 2026)
.
Usage
ConcordanceTable(
  tree,
  dataset,
  Col = QACol,
  largeClade = 0,
  xlab = "Edge",
  ylab = "Character",
  normalize = TRUE,
  ...
)
Arguments
- tree
A tree of class
phylo.- dataset
A phylogenetic data matrix of phangorn class
phyDat, whose names correspond to the labels of any accompanying tree. Perhaps load into R usingReadAsPhyDat(). Additive (ordered) characters can be handled usingDecompose().- Col
Function that takes vectors
amountandqualityand returns a vector of colours. QCol colours by data quality (concordance); QACol by quality and amount of information.- largeClade
Integer; if greater than 1, vertical lines will be drawn at edges whose descendants are both contain more than
largeCladeleaves.- xlab
Character giving a label for the x axis.
- ylab
Character giving a label for the y axis.
- normalize
Controls how the expected mutual information (the zero point of the scale) is determined.
FALSE: no chance correction; MI is scaled only by its maximum.TRUE: subtract the analytical expected MI for random association.<integer>: subtract an empirical expected MI estimated from that number of random trees.
In all cases, 1 corresponds to the maximal attainable MI for the pair (
hBest), and 0 corresponds to the chosen expectation.- ...
Arguments to
abline, to control the appearance of vertical lines marking important edges.
Value
ConcordanceTable() invisibly returns an named list containing:
"info": The amount of information in each character-edge pair, in bits;"relInfo": The information, normalized to the most information-rich pair;"quality": The normalized mutual information of the pair;"col": The colours used to plot the table.
References
Smith MR (2026). “Which characters support which clades? Exploring the distribution of phylogenetic signal using concordant information.” Forthcoming.
See also
SiteConcordance(): compute underlying concordance values.
Other split support functions:
JackLabels(),
Jackknife(),
MaximizeParsimony(),
MostContradictedFreq(),
PresCont(),
SiteConcordance
Examples
# Load data and tree
data("congreveLamsdellMatrices", package = "TreeSearch")
dataset <- congreveLamsdellMatrices[[1]][, 1:20]
tree <- referenceTree
# Plot tree and identify nodes
library("TreeTools", quietly = TRUE)
plot(tree)
nodeIndex <- as.integer(rownames(as.Splits(tree)))
nodelabels(seq_along(nodeIndex), nodeIndex, adj = c(2, 1),
frame = "none", bg = NULL)
QALegend(where = c(0.1, 0.4, 0.1, 0.3))
 # View information shared by characters and edges
ConcordanceTable(tree, dataset, largeClade = 3, col = 2, lwd = 3)
axis(1)
axis(2)
# View information shared by characters and edges
ConcordanceTable(tree, dataset, largeClade = 3, col = 2, lwd = 3)
axis(1)
axis(2)
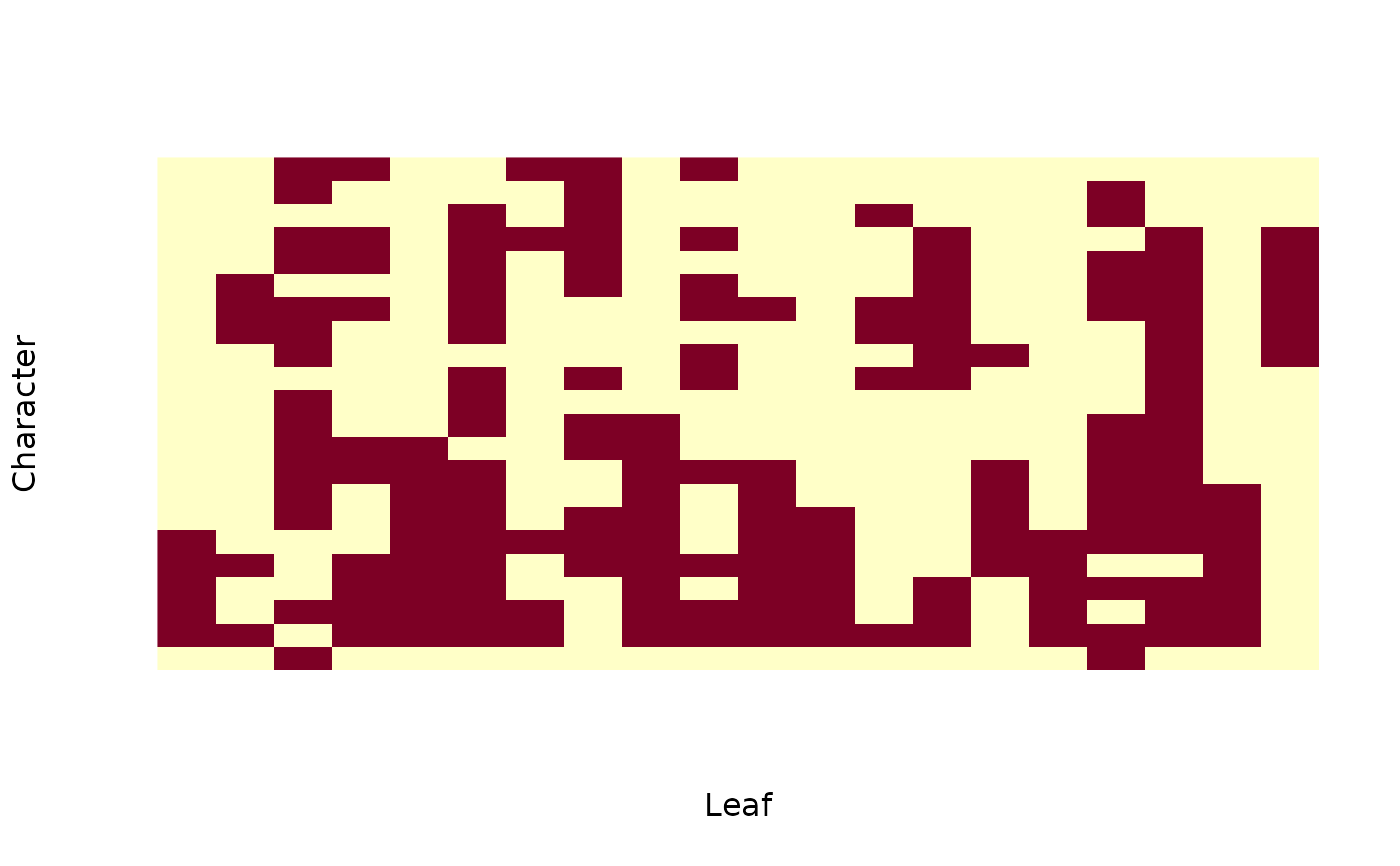
 # Visualize dataset
image(t(`mode<-`(PhyDatToMatrix(dataset), "numeric")), axes = FALSE,
xlab = "Leaf", ylab = "Character")
# Visualize dataset
image(t(`mode<-`(PhyDatToMatrix(dataset), "numeric")), axes = FALSE,
xlab = "Leaf", ylab = "Character")