SplitFrequency() provides a simple way to count the number of times that
bipartition splits, as defined by a reference tree, occur in a forest of
trees. May be used to calculate edge ("node") support for majority consensus
or bootstrap trees.
Arguments
- reference
A tree of class
phylo, aSplitsobject. IfNULL, the frequencies of all splits inforestwill be returned.- forest
A list of trees of class
phylo, or amultiPhyloobject; or aSplitsobject. See vignette for possible methods of loading trees into R.- hash
Logical; if
TRUE(default), counts the frequencies of all splits (i.e. whenreference = NULL) using a faster 128-bit hashing approach whose results are exact with overwhelming probability (a hash collision conflating two distinct splits is vanishingly unlikely). Sethash = FALSEfor a slower but guaranteed-exact count. Ignored whenreferenceis a tree orSplitsobject.
Value
SplitFrequency() returns the number of trees in forest that
contain each split in reference.
If reference is a tree of class phylo, then the sequence will correspond
to the order of nodes (use ape::nodelabels() to view).
Note that the three nodes at the root of the tree correspond to a single
split; see the example for how these might be plotted on a tree.
If reference is NULL, then SplitFrequency() returns a list of splits
(in the order encountered in forest) with attribute "count" stating the
number of times each split occurs in forest.
Details
If multiple calculations are required, some time can be saved by using the constituent functions (see examples).
See also
Other Splits operations:
LabelSplits(),
NSplits(),
NTip(),
PolarizeSplits(),
Splits,
SplitsInBinaryTree(),
TipLabels(),
TipsInSplits(),
match,Splits,Splits-method,
xor()
Examples
# An example forest of 100 trees, some identical
forest <- as.phylo(c(1, rep(10, 79), rep(100, 15), rep(1000, 5)), nTip = 9)
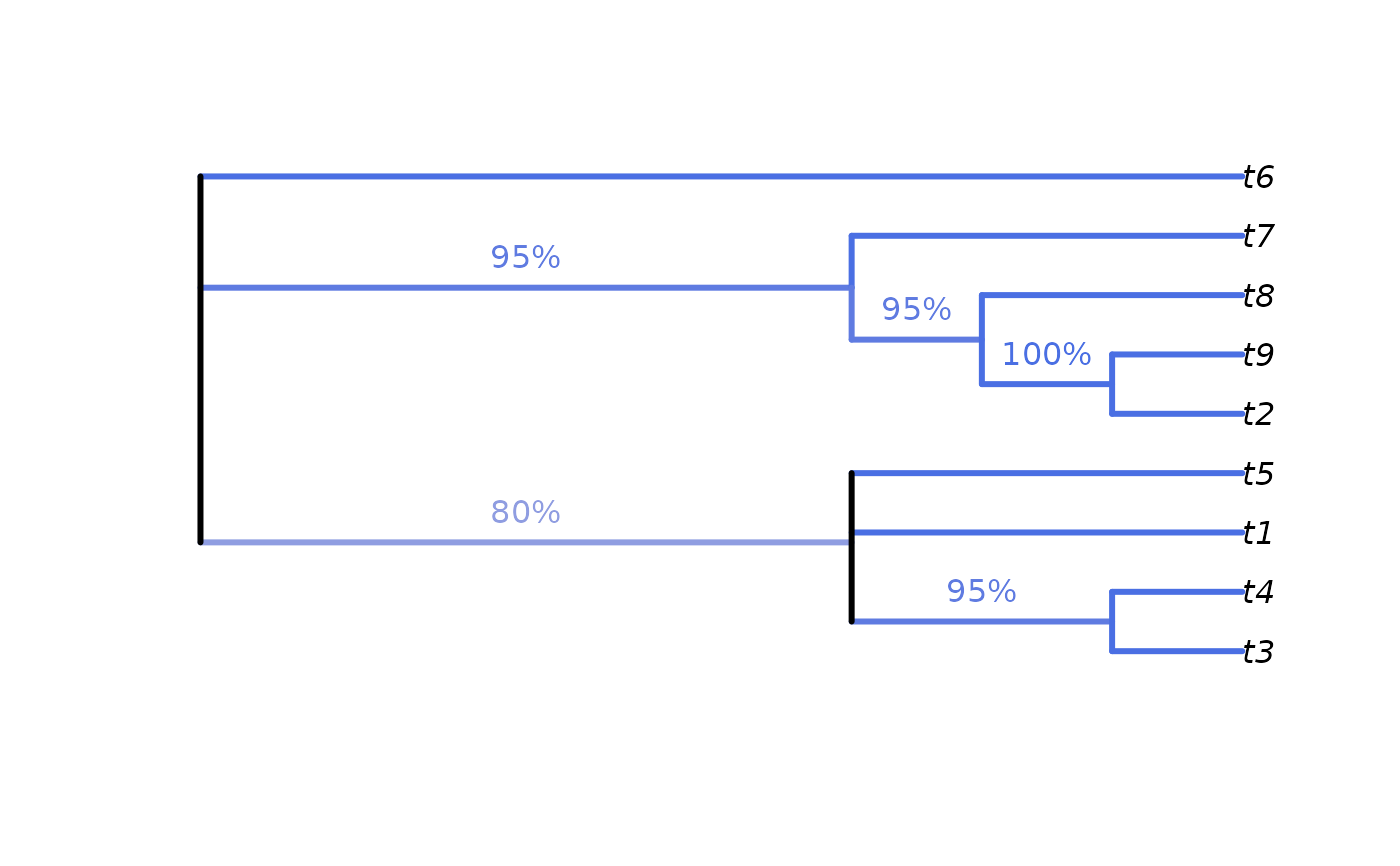
# Generate an 80% consensus tree
cons <- ape::consensus(forest, p = 0.8)
plot(cons)
 # Calculate split frequencies
splitFreqs <- SplitFrequency(cons, forest)
# Optionally, colour edges by corresponding frequency.
# Note that not all edges are associated with a unique split
# (and two root edges may be associated with one split - not handled here)
edgeSupport <- rep(1, nrow(cons$edge)) # Initialize trivial splits to 1
childNode <- cons$edge[, 2]
edgeSupport[match(names(splitFreqs), childNode)] <- splitFreqs / 100
plot(cons, edge.col = SupportColour(edgeSupport), edge.width = 3)
# Annotate nodes by frequency
LabelSplits(cons, splitFreqs, unit = "%",
col = SupportColor(splitFreqs / 100),
frame = "none", pos = 3L)
# Calculate split frequencies
splitFreqs <- SplitFrequency(cons, forest)
# Optionally, colour edges by corresponding frequency.
# Note that not all edges are associated with a unique split
# (and two root edges may be associated with one split - not handled here)
edgeSupport <- rep(1, nrow(cons$edge)) # Initialize trivial splits to 1
childNode <- cons$edge[, 2]
edgeSupport[match(names(splitFreqs), childNode)] <- splitFreqs / 100
plot(cons, edge.col = SupportColour(edgeSupport), edge.width = 3)
# Annotate nodes by frequency
LabelSplits(cons, splitFreqs, unit = "%",
col = SupportColor(splitFreqs / 100),
frame = "none", pos = 3L)