Labels the edges associated with each split on a plotted tree.
Arguments
- tree
A tree of class
phylo.- labels
Named vector listing annotations for each split. Names should correspond to the node associated with each split; see
as.Splits()for details. IfNULL, each splits will be labelled with its associated node.- unit
Character specifying units of
labels, if desired. Include a leading space if necessary.- ...
Additional parameters to
ape::edgelabels().
Value
LabelSplits() returns invisible(), after plotting labels on
each relevant edge of a plot (which should already have been produced using
plot(tree)).
Details
As the two root edges of a rooted tree denote the same split, only the
rightmost (plotted at the bottom, by default) edge will be labelled.
If the position of the root is significant, add a tip at the root using
AddTip().
See also
Calculate split support: SplitFrequency()
Colour labels according to value: SupportColour()
Other Splits operations:
NSplits(),
NTip(),
PolarizeSplits(),
SplitFrequency(),
Splits,
SplitsInBinaryTree(),
TipLabels(),
TipsInSplits(),
match,Splits,Splits-method,
xor()
Examples
tree <- BalancedTree(LETTERS[1:5])
splits <- as.Splits(tree)
plot(tree)
LabelSplits(tree, as.character(splits), frame = "none", pos = 3L)
LabelSplits(tree, TipsInSplits(splits), unit = " tips", frame = "none",
pos = 1L)
 # An example forest of 100 trees, some identical
forest <- as.phylo(c(1, rep(10, 79), rep(100, 15), rep(1000, 5)), nTip = 9)
# Generate an 80% consensus tree
cons <- ape::consensus(forest, p = 0.8)
plot(cons)
# An example forest of 100 trees, some identical
forest <- as.phylo(c(1, rep(10, 79), rep(100, 15), rep(1000, 5)), nTip = 9)
# Generate an 80% consensus tree
cons <- ape::consensus(forest, p = 0.8)
plot(cons)
 # Calculate split frequencies
splitFreqs <- SplitFrequency(cons, forest)
# Optionally, colour edges by corresponding frequency.
# Note that not all edges are associated with a unique split
# (and two root edges may be associated with one split - not handled here)
edgeSupport <- rep(1, nrow(cons$edge)) # Initialize trivial splits to 1
childNode <- cons$edge[, 2]
edgeSupport[match(names(splitFreqs), childNode)] <- splitFreqs / 100
plot(cons, edge.col = SupportColour(edgeSupport), edge.width = 3)
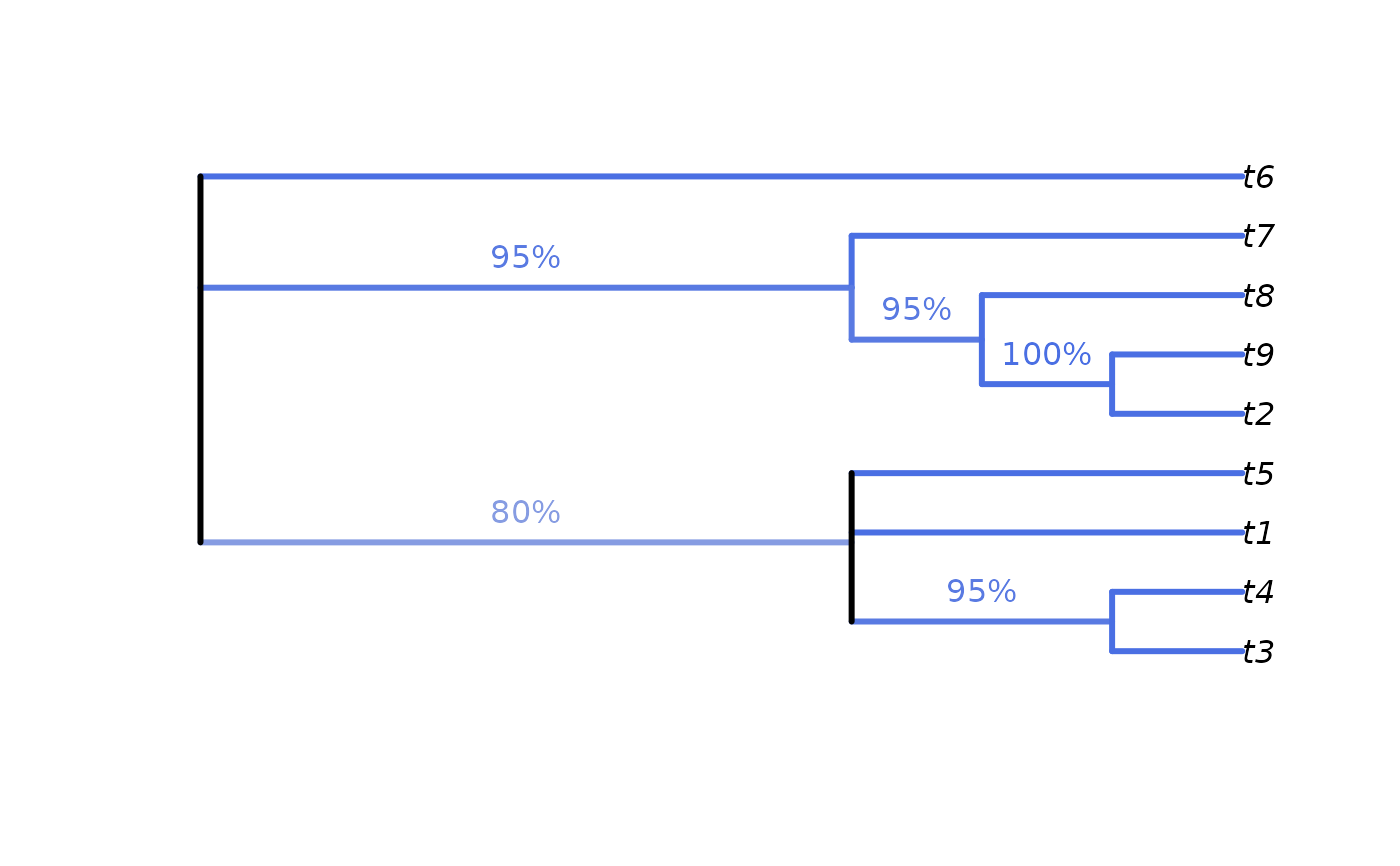
# Annotate nodes by frequency
LabelSplits(cons, splitFreqs, unit = "%",
col = SupportColor(splitFreqs / 100),
frame = "none", pos = 3L)
# Calculate split frequencies
splitFreqs <- SplitFrequency(cons, forest)
# Optionally, colour edges by corresponding frequency.
# Note that not all edges are associated with a unique split
# (and two root edges may be associated with one split - not handled here)
edgeSupport <- rep(1, nrow(cons$edge)) # Initialize trivial splits to 1
childNode <- cons$edge[, 2]
edgeSupport[match(names(splitFreqs), childNode)] <- splitFreqs / 100
plot(cons, edge.col = SupportColour(edgeSupport), edge.width = 3)
# Annotate nodes by frequency
LabelSplits(cons, splitFreqs, unit = "%",
col = SupportColor(splitFreqs / 100),
frame = "none", pos = 3L)